Census Analytical Report - Uganda Bureau of Statistics
Census Analytical Report - Uganda Bureau of Statistics
Census Analytical Report - Uganda Bureau of Statistics
You also want an ePaper? Increase the reach of your titles
YUMPU automatically turns print PDFs into web optimized ePapers that Google loves.
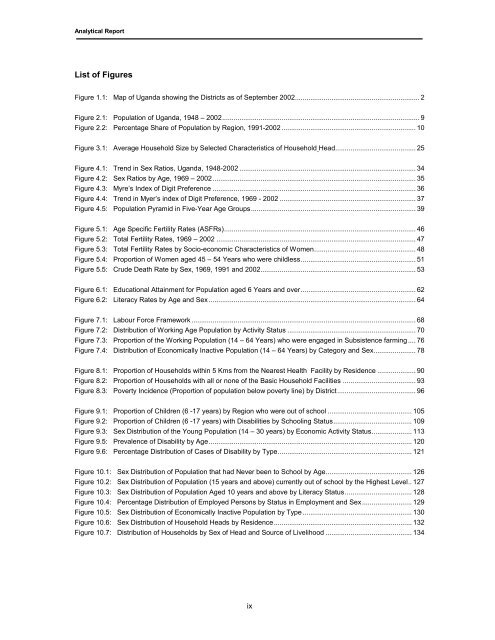
<strong>Analytical</strong> <strong>Report</strong>List <strong>of</strong> FiguresFigure 1.1: Map <strong>of</strong> <strong>Uganda</strong> showing the Districts as <strong>of</strong> September 2002................................................................. 2Figure 2.1: Population <strong>of</strong> <strong>Uganda</strong>, 1948 – 2002....................................................................................................... 9Figure 2.2: Percentage Share <strong>of</strong> Population by Region, 1991-2002 ...................................................................... 10Figure 3.1: Average Household Size by Selected Characteristics <strong>of</strong> Household Head.......................................... 25Figure 4.1: Trend in Sex Ratios, <strong>Uganda</strong>, 1948-2002 ............................................................................................ 34Figure 4.2: Sex Ratios by Age, 1969 – 2002.......................................................................................................... 35Figure 4.3: Myre’s Index <strong>of</strong> Digit Preference .......................................................................................................... 36Figure 4.4: Trend in Myer’s index <strong>of</strong> Digit Preference, 1969 - 2002 ....................................................................... 37Figure 4.5: Population Pyramid in Five-Year Age Groups...................................................................................... 39Figure 5.1: Age Specific Fertility Rates (ASFRs).................................................................................................... 46Figure 5.2: Total Fertility Rates, 1969 – 2002 ........................................................................................................ 47Figure 5.3: Total Fertility Rates by Socio-economic Characteristics <strong>of</strong> Women..................................................... 48Figure 5.4: Proportion <strong>of</strong> Women aged 45 – 54 Years who were childless............................................................ 51Figure 5.5: Crude Death Rate by Sex, 1969, 1991 and 2002................................................................................. 53Figure 6.1: Educational Attainment for Population aged 6 Years and over............................................................ 62Figure 6.2: Literacy Rates by Age and Sex ............................................................................................................ 64Figure 7.1: Labour Force Framework ..................................................................................................................... 68Figure 7.2: Distribution <strong>of</strong> Working Age Population by Activity Status ................................................................... 70Figure 7.3: Proportion <strong>of</strong> the Working Population (14 – 64 Years) who were engaged in Subsistence farming .... 76Figure 7.4: Distribution <strong>of</strong> Economically Inactive Population (14 – 64 Years) by Category and Sex...................... 78Figure 8.1: Proportion <strong>of</strong> Households within 5 Kms from the Nearest Health Facility by Residence .................... 90Figure 8.2: Proportion <strong>of</strong> Households with all or none <strong>of</strong> the Basic Household Facilities ...................................... 93Figure 8.3: Poverty Incidence (Proportion <strong>of</strong> population below poverty line) by District......................................... 96Figure 9.1: Proportion <strong>of</strong> Children (6 -17 years) by Region who were out <strong>of</strong> school ............................................ 105Figure 9.2: Proportion <strong>of</strong> Children (6 -17 years) with Disabilities by Schooling Status......................................... 109Figure 9.3: Sex Distribution <strong>of</strong> the Young Population (14 – 30 years) by Economic Activity Status..................... 113Figure 9.5: Prevalence <strong>of</strong> Disability by Age.......................................................................................................... 120Figure 9.6: Percentage Distribution <strong>of</strong> Cases <strong>of</strong> Disability by Type...................................................................... 121Figure 10.1: Sex Distribution <strong>of</strong> Population that had Never been to School by Age............................................. 126Figure 10.2: Sex Distribution <strong>of</strong> Population (15 years and above) currently out <strong>of</strong> school by the Highest Level.. 127Figure 10.3: Sex Distribution <strong>of</strong> Population Aged 10 years and above by Literacy Status................................... 128Figure 10.4: Percentage Distribution <strong>of</strong> Employed Persons by Status in Employment and Sex.......................... 129Figure 10.5: Sex Distribution <strong>of</strong> Economically Inactive Population by Type ......................................................... 130Figure 10.6: Sex Distribution <strong>of</strong> Household Heads by Residence........................................................................ 132Figure 10.7: Distribution <strong>of</strong> Households by Sex <strong>of</strong> Head and Source <strong>of</strong> Livelihood ............................................. 134ix


