Census Analytical Report - Uganda Bureau of Statistics
Census Analytical Report - Uganda Bureau of Statistics
Census Analytical Report - Uganda Bureau of Statistics
Create successful ePaper yourself
Turn your PDF publications into a flip-book with our unique Google optimized e-Paper software.
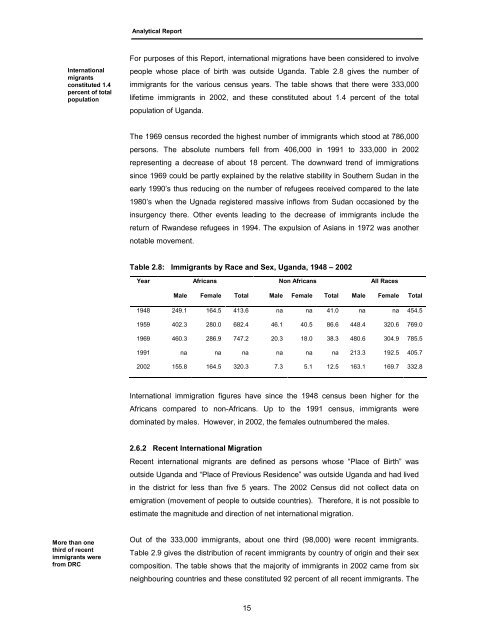
<strong>Analytical</strong> <strong>Report</strong>Internationalmigrantsconstituted 1.4percent <strong>of</strong> totalpopulationFor purposes <strong>of</strong> this <strong>Report</strong>, international migrations have been considered to involvepeople whose place <strong>of</strong> birth was outside <strong>Uganda</strong>. Table 2.8 gives the number <strong>of</strong>immigrants for the various census years. The table shows that there were 333,000lifetime immigrants in 2002, and these constituted about 1.4 percent <strong>of</strong> the totalpopulation <strong>of</strong> <strong>Uganda</strong>.The 1969 census recorded the highest number <strong>of</strong> immigrants which stood at 786,000persons. The absolute numbers fell from 406,000 in 1991 to 333,000 in 2002representing a decrease <strong>of</strong> about 18 percent. The downward trend <strong>of</strong> immigrationssince 1969 could be partly explained by the relative stability in Southern Sudan in theearly 1990’s thus reducing on the number <strong>of</strong> refugees received compared to the late1980’s when the Ugnada registered massive inflows from Sudan occasioned by theinsurgency there. Other events leading to the decrease <strong>of</strong> immigrants include thereturn <strong>of</strong> Rwandese refugees in 1994. The expulsion <strong>of</strong> Asians in 1972 was anothernotable movement.Table 2.8: Immigrants by Race and Sex, <strong>Uganda</strong>, 1948 – 2002Year Africans Non Africans All RacesMale Female Total Male Female Total Male Female Total1948 249.1 164.5 413.6 na na 41.0 na na 454.51959 402.3 280.0 682.4 46.1 40.5 86.6 448.4 320.6 769.01969 460.3 286.9 747.2 20.3 18.0 38.3 480.6 304.9 785.51991 na na na na na na 213.3 192.5 405.72002 155.8 164.5 320.3 7.3 5.1 12.5 163.1 169.7 332.8International immigration figures have since the 1948 census been higher for theAfricans compared to non-Africans. Up to the 1991 census, immigrants weredominated by males. However, in 2002, the females outnumbered the males.2.6.2 Recent International MigrationRecent international migrants are defined as persons whose “Place <strong>of</strong> Birth” wasoutside <strong>Uganda</strong> and “Place <strong>of</strong> Previous Residence” was outside <strong>Uganda</strong> and had livedin the district for less than five 5 years. The 2002 <strong>Census</strong> did not collect data onemigration (movement <strong>of</strong> people to outside countries). Therefore, it is not possible toestimate the magnitude and direction <strong>of</strong> net international migration.More than onethird <strong>of</strong> recentimmigrants werefrom DRCOut <strong>of</strong> the 333,000 immigrants, about one third (98,000) were recent immigrants.Table 2.9 gives the distribution <strong>of</strong> recent immigrants by country <strong>of</strong> origin and their sexcomposition. The table shows that the majority <strong>of</strong> immigrants in 2002 came from sixneighbouring countries and these constituted 92 percent <strong>of</strong> all recent immigrants. The15


