Census Analytical Report - Uganda Bureau of Statistics
Census Analytical Report - Uganda Bureau of Statistics
Census Analytical Report - Uganda Bureau of Statistics
Create successful ePaper yourself
Turn your PDF publications into a flip-book with our unique Google optimized e-Paper software.
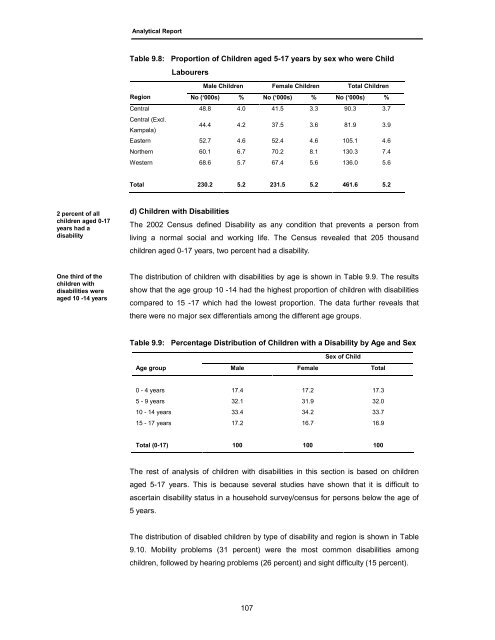
<strong>Analytical</strong> <strong>Report</strong>Table 9.8: Proportion <strong>of</strong> Children aged 5-17 years by sex who were ChildLabourersMale Children Female Children Total ChildrenRegion No (‘000s) % No (‘000s) % No (‘000s) %Central 48.8 4.0 41.5 3.3 90.3 3.7Central (Excl.Kampala)44.4 4.2 37.5 3.6 81.9 3.9Eastern 52.7 4.6 52.4 4.6 105.1 4.6Northern 60.1 6.7 70.2 8.1 130.3 7.4Western 68.6 5.7 67.4 5.6 136.0 5.6Total 230.2 5.2 231.5 5.2 461.6 5.22 percent <strong>of</strong> allchildren aged 0-17years had adisabilityd) Children with DisabilitiesThe 2002 <strong>Census</strong> defined Disability as any condition that prevents a person fromliving a normal social and working life. The <strong>Census</strong> revealed that 205 thousandchildren aged 0-17 years, two percent had a disability.One third <strong>of</strong> thechildren withdisabilities wereaged 10 -14 yearsThe distribution <strong>of</strong> children with disabilities by age is shown in Table 9.9. The resultsshow that the age group 10 -14 had the highest proportion <strong>of</strong> children with disabilitiescompared to 15 -17 which had the lowest proportion. The data further reveals thatthere were no major sex differentials among the different age groups.Table 9.9: Percentage Distribution <strong>of</strong> Children with a Disability by Age and SexSex <strong>of</strong> ChildAge group Male Female Total0 - 4 years 17.4 17.2 17.35 - 9 years 32.1 31.9 32.010 - 14 years 33.4 34.2 33.715 - 17 years 17.2 16.7 16.9Total (0-17) 100 100 100The rest <strong>of</strong> analysis <strong>of</strong> children with disabilities in this section is based on childrenaged 5-17 years. This is because several studies have shown that it is difficult toascertain disability status in a household survey/census for persons below the age <strong>of</strong>5 years.The distribution <strong>of</strong> disabled children by type <strong>of</strong> disability and region is shown in Table9.10. Mobility problems (31 percent) were the most common disabilities amongchildren, followed by hearing problems (26 percent) and sight difficulty (15 percent).107


