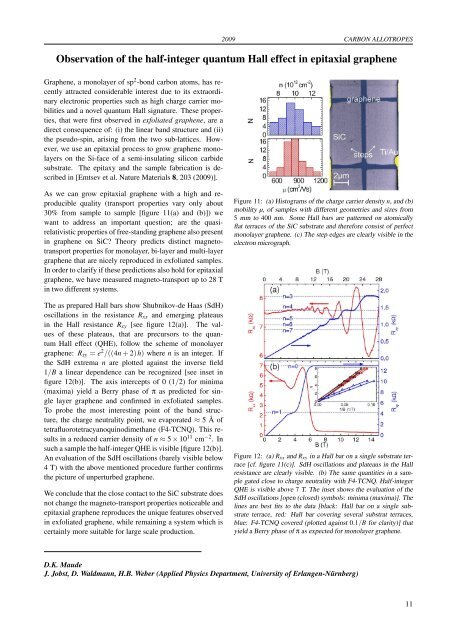
2009 CARBON ALLOTROPESObservation of the half-integer quantum Hall effect in epitaxial graph<strong>en</strong>eGraph<strong>en</strong>e, a monolayer of sp 2 -bond carbon atoms, has rec<strong>en</strong>tlyattracted considerable interest due to its extraordinaryelectronic properties such as high charge carrier mobilitiesand a novel quantum Hall signature. These properties,that were first observed in exfoliated graph<strong>en</strong>e, are adirect consequ<strong>en</strong>ce of: (i) the linear band structure and (ii)the pseudo-spin, arising from the two sub-lattices. However,we use an epitaxial process to grow graph<strong>en</strong>e monolayerson the Si-face of a semi-insulating silicon carbi<strong>des</strong>ubstrate. The epitaxy and the sample fabrication is <strong>des</strong>cribedin [Emtsev et al. Nature Materials 8, 203 (2009)].As we can grow epitaxial graph<strong>en</strong>e with a high and reproduciblequality (transport properties vary only about30% from sample to sample [figure 11(a) and (b)]) wewant to address an important question; are the quasirelativisticproperties of free-standing graph<strong>en</strong>e also pres<strong>en</strong>tin graph<strong>en</strong>e on SiC? Theory predicts distinct magnetotransportproperties for monolayer, bi-layer and multi-layergraph<strong>en</strong>e that are nicely reproduced in exfoliated samples.In order to clarify if these predictions also hold for epitaxialgraph<strong>en</strong>e, we have measured magneto-transport up to 28 Tin two differ<strong>en</strong>t systems.The as prepared Hall bars show Shubnikov-de Haas (SdH)oscillations in the resistance R xx and emerging plateausin the Hall resistance R xy [see figure 12(a)]. The valuesof these plateaus, that are precursors to the quantumHall effect (QHE), follow the scheme of monolayergraph<strong>en</strong>e: R xy = e 2 /((4n + 2)h) where n is an integer. Ifthe SdH extrema n are plotted against the inverse field1/B a linear dep<strong>en</strong>d<strong>en</strong>ce can be recognized [see inset infigure 12(b)]. The axis intercepts of 0 (1/2) for minima(maxima) yield a Berry phase of π as predicted for singlelayer graph<strong>en</strong>e and confirmed in exfoliated samples.To probe the most interesting point of the band structure,the charge neutrality point, we evaporated ≈ 5 Å oftetrafluorotetracyanoquinodimethane (F4-TCNQ). This resultsin a reduced carrier d<strong>en</strong>sity of n ≈ 5 × 10 11 cm −2 . Insuch a sample the half-integer QHE is visible [figure 12(b)].An evaluation of the SdH oscillations (barely visible below4 T) with the above m<strong>en</strong>tioned procedure further confirmsthe picture of unperturbed graph<strong>en</strong>e.We conclude that the close contact to the SiC substrate doesnot change the magneto-transport properties noticeable andepitaxial graph<strong>en</strong>e reproduces the unique features observedin exfoliated graph<strong>en</strong>e, while remaining a system which iscertainly more suitable for large scale production.Figure 11: (a) Histograms of the charge carrier d<strong>en</strong>sity n, and (b)mobility µ, of samples with differ<strong>en</strong>t geometries and sizes from5 mm to 400 nm. Some Hall bars are patterned on atomicallyflat terraces of the SiC substrate and therefore consist of perfectmonolayer graph<strong>en</strong>e. (c) The step edges are clearly visible in theelectron micrograph.Figure 12: (a) R xx and R xy in a Hall bar on a single substrate terrace[cf. figure 11(c)]. SdH oscillations and plateaus in the Hallresistance are clearly visible. (b) The same quantities in a samplegated close to charge neutrality with F4-TCNQ. Half-integerQHE is visible above 7 T. The inset shows the evaluation of theSdH oscillations [op<strong>en</strong> (closed) symbols: minima (maxima)]. Thelines are best fits to the data [black: Hall bar on a single substrateterrace, red: Hall bar covering several substrat terraces,blue: F4-TCNQ covered (plotted against 0.1/B for clarity)] thatyield a Berry phase of π as expected for monolayer graph<strong>en</strong>e.D.K. MaudeJ. Jobst, D. Waldmann, H.B. Weber (Applied Physics Departm<strong>en</strong>t, University of Erlang<strong>en</strong>-Nürnberg)11
CARBON ALLOTROPES 2009Integer quantum Hall effect in epitaxial graph<strong>en</strong>eIn graph<strong>en</strong>e, a single sheet of hexagonally arranged carbonatoms, electrons behave as Dirac fermions while stillexhibiting the quantum Hall effect wh<strong>en</strong> subjected to a normalmagnetic field. Epitaxial graph<strong>en</strong>e grown on SiC showsmost of the properties of single layer graph<strong>en</strong>e (e.g. Landaulevel quantization), nevertheless, the quantum Hall effectremains elusive in this material. Very rec<strong>en</strong>tly, the productionof high mobility (∼20 000 cm 2 /Vs) single-layergraph<strong>en</strong>e on the C-face of SiC single crystalline wafershas <strong>en</strong>able the observation of quantum Hall plateaus atthe predicted values for graph<strong>en</strong>e ( σ xy = νe 2 /h, with ν =4(N + 1/2) where N is the Landau level index, unambiguouslydemonstrating the graph<strong>en</strong>e like nature of epitaxialgraph<strong>en</strong>e [Wu et al. Appl. Phys. Lett. 95, 223108 (2009)].single terrace) or over steps, to investigate the influ<strong>en</strong>ce ofsubstrate and defects on well-characterized samples. Conversely,these studies will bring insights on the pot<strong>en</strong>tialof epitaxial graph<strong>en</strong>e as a scalable platform for graph<strong>en</strong>ebasedelectronics, with pot<strong>en</strong>tial applications in metrologyat room temperature.In this work, we ext<strong>en</strong>d this observation to magnetic fieldsup to 32 T where we observe the quantum Hall effect atfilling factor 1. This quantum Hall state is shown to be particularrobust against temperature in the epitaxial graph<strong>en</strong>esamples investigated here.In figure 13, the ν = 1 quantum Hall effect can be id<strong>en</strong>tifiedby a true zero-resistance state in the longitudinal resistivityρ xx . At the lowest temperatures a minimum is se<strong>en</strong> in ρ xxaround B ∼ 7.3T, probably related to the emerg<strong>en</strong>ce of a gapat ν = 4. In this temperature range, ρ xx also exhibits sharpreproducible features coexisting with the quantum Hall effect,which are t<strong>en</strong>tatively assigned to mesoscopic effects.Due to the spin and pseudo-spin degrees of freedom of electronsin graph<strong>en</strong>e, the Landau levels are four-fold deg<strong>en</strong>erateand the quantum Hall effect is thus observed for fillingfactors ν = 4(N + 1/2) (where N is the Landau level index)wh<strong>en</strong> this deg<strong>en</strong>eracy is not lifted. The origin (spinor pseudo-spin) of the observed ν =1 (and ν =4) quantumHall states is curr<strong>en</strong>tly the subject of debate [Z. Jiang et al.Phys. Rev. Lett. 99, 106802 (2007)].The temperature robustness of the quantum Hall effect observedin exfoliated graph<strong>en</strong>e [K. S. Novoselov et al. Sci<strong>en</strong>ce315, 1379 (2007)] is also pres<strong>en</strong>t in epitaxial graph<strong>en</strong>e.In figure 14, the longitudinal R xx and Hall resistance R xy areplotted as a function of the magnetic field. The R xy quantizationat ν = 2 persists spectacularly up to room temperature.This behaviour, which primarily emanates from thevery large value of the cyclotron gap in graph<strong>en</strong>e, also reflectsthe weak temperature dep<strong>en</strong>dance of the Landau levelbroad<strong>en</strong>ing.The observation of the quantum Hall effect in epitaxialgraph<strong>en</strong>e op<strong>en</strong>s new av<strong>en</strong>ues for graph<strong>en</strong>e physics: epitaxialgraph<strong>en</strong>e for the first time offers the possibility to studygraph<strong>en</strong>e layers on a atomically flat surface (device on aFigure 13: Longitudinale magnetoresistivity at T ∼ 20mK temperature.The filling factors corresponding to the observed QHstates are indicated.Figure 14: Temperature robustness of the quantum Hall effect.Longitudinale magnetoresistivity ρ xx at T = 4K (dashed line, rightscale). Hall resistance R xy as a function of the magnetic field fordiffer<strong>en</strong>t temperatures: T = 4K (thick line), and T = 300K (thinline).B.A. Piot, C. Faugeras, M. Potemski, D.K. MaudeC. Berger, W. A. de Heer (School of Physics, Georgia Institute of Technology, Atlanta, USA)12
- Page 1 and 2: LABORATOIRE NATIONAL DES CHAMPS MAG
- Page 4 and 5: TABLE OF CONTENTSPreface 1Carbon Al
- Page 6 and 7: Coexistence of closed orbit and qua
- Page 8: 2009PrefaceDear Reader,You have bef
- Page 12 and 13: 2009 CARBON ALLOTROPESInvestigation
- Page 14 and 15: 2009 CARBON ALLOTROPESPropagative L
- Page 16 and 17: 2009 CARBON ALLOTROPESEdge fingerpr
- Page 20 and 21: 2009 CARBON ALLOTROPESImproving gra
- Page 22 and 23: 2009 CARBON ALLOTROPESHow perfect c
- Page 24 and 25: 2009 CARBON ALLOTROPESTuning the el
- Page 26 and 27: 2009 CARBON ALLOTROPESElectric fiel
- Page 28 and 29: 2009 CARBON ALLOTROPESMagnetotransp
- Page 30 and 31: 2009 CARBON ALLOTROPESGraphite from
- Page 32: 2009Two-Dimensional Electron Gas25
- Page 35 and 36: TWO-DIMENSIONAL ELECTRON GAS 2009Di
- Page 37 and 38: TWO-DIMENSIONAL ELECTRON GAS 2009Sp
- Page 39 and 40: TWO-DIMENSIONAL ELECTRON GAS 2009Cr
- Page 41 and 42: TWO-DIMENSIONAL ELECTRON GAS 2009Re
- Page 43 and 44: TWO-DIMENSIONAL ELECTRON GAS 2009In
- Page 45 and 46: TWO-DIMENSIONAL ELECTRON GAS 2009Ho
- Page 47 and 48: TWO-DIMENSIONAL ELECTRON GAS 2009Te
- Page 50 and 51: 2009 SEMICONDUCTORS AND NANOSTRUCTU
- Page 52 and 53: 2009 SEMICONDUCTORS AND NANOSTRUCTU
- Page 54 and 55: 2009 SEMICONDUCTORS AND NANOSTRUCTU
- Page 56 and 57: 2009 SEMICONDUCTORS AND NANOSTRUCTU
- Page 58 and 59: 2009 SEMICONDUCTORS AND NANOSTRUCTU
- Page 60: 2009Metals, Superconductors and Str
- Page 63 and 64: METALS, SUPERCONDUCTORS... 2009Anom
- Page 65 and 66: METALS, SUPERCONDUCTORS... 2009Magn
- Page 67 and 68: METALS, SUPERCONDUCTORS ... 2009Coe
- Page 69 and 70:
METALS, SUPERCONDUCTORS ... 2009Fie
- Page 71 and 72:
METALS, SUPERCONDUCTORS... 2009High
- Page 73 and 74:
METALS, SUPERCONDUCTORS... 2009Angu
- Page 75 and 76:
METALS, SUPERCONDUCTORS... 2009Magn
- Page 77 and 78:
METALS, SUPERCONDUCTORS... 2009Meta
- Page 79 and 80:
METALS, SUPERCONDUCTORS... 2009Temp
- Page 81 and 82:
METALS, SUPERCONDUCTORS... 200974
- Page 84 and 85:
2009 MAGNETIC SYSTEMSY b 3+ → Er
- Page 86 and 87:
2009 MAGNETIC SYSTEMSMagnetotranspo
- Page 88 and 89:
2009 MAGNETIC SYSTEMSHigh field tor
- Page 90 and 91:
2009 MAGNETIC SYSTEMSNuclear magnet
- Page 92 and 93:
2009 MAGNETIC SYSTEMSStructural ana
- Page 94 and 95:
2009 MAGNETIC SYSTEMSEnhancement ma
- Page 96 and 97:
2009 MAGNETIC SYSTEMSInvestigation
- Page 98 and 99:
2009 MAGNETIC SYSTEMSField-induced
- Page 100 and 101:
2009 MAGNETIC SYSTEMSMagnetic prope
- Page 102:
2009Biology, Chemistry and Soft Mat
- Page 105 and 106:
BIOLOGY, CHEMISTRY AND SOFT MATTER
- Page 108 and 109:
2009 APPLIED SUPERCONDUCTIVITYMagne
- Page 110 and 111:
2009 APPLIED SUPERCONDUCTIVITYPhtha
- Page 112:
2009Magneto-Science105
- Page 115 and 116:
MAGNETO-SCIENCE 2009Study of the in
- Page 117 and 118:
MAGNETO-SCIENCE 2009Magnetohydrodyn
- Page 119 and 120:
MAGNETO-SCIENCE 2009112
- Page 122 and 123:
2009 MAGNET DEVELOPMENT AND INSTRUM
- Page 124 and 125:
2009 MAGNET DEVELOPMENT AND INSTRUM
- Page 126 and 127:
2009 MAGNET DEVELOPMENT AND INSTRUM
- Page 128 and 129:
2009 MAGNET DEVELOPMENT AND INSTRUM
- Page 130 and 131:
2009 MAGNET DEVELOPMENT AND INSTRUM
- Page 132 and 133:
2009 MAGNET DEVELOPMENT AND INSTRUM
- Page 134 and 135:
2009 MAGNET DEVELOPMENT AND INSTRUM
- Page 136 and 137:
2009 PROPOSALSProposals for Magnet
- Page 138 and 139:
2009 PROPOSALSSpin-Jahn-Teller effe
- Page 140 and 141:
2009 PROPOSALSQuantum Oscillations
- Page 142 and 143:
2009 PROPOSALSThermoelectric tensor
- Page 144 and 145:
2009 PROPOSALSDr. EscoffierCyclotro
- Page 146 and 147:
2009 PROPOSALSHigh field magnetotra
- Page 148 and 149:
2009 THESESPhD Theses 20091. Nanot
- Page 150 and 151:
2009 PUBLICATIONS[21] O. Drachenko,
- Page 152 and 153:
2009 PUBLICATIONS[75] S. Nowak, T.
- Page 154 and 155:
Contributors of the LNCMI to the Pr
- Page 156 and 157:
Institut Jean Lamour, Nancy : 68Ins
- Page 158 and 159:
Lawrence Berkeley National Laborato