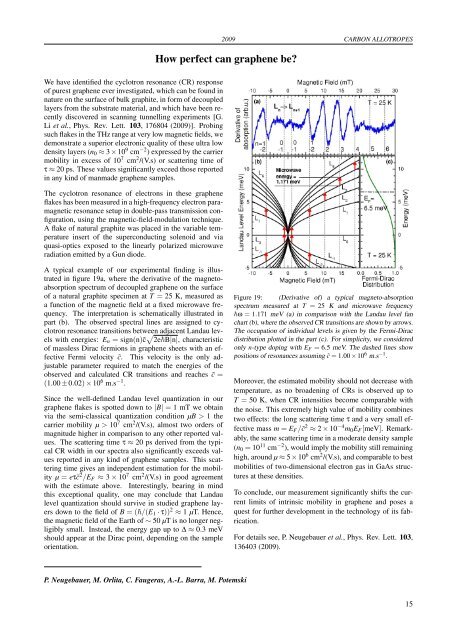
2009 CARBON ALLOTROPESHow perfect can graph<strong>en</strong>e be?We have id<strong>en</strong>tified the cyclotron resonance (CR) responseof purest graph<strong>en</strong>e ever investigated, which can be found innature on the surface of bulk graphite, in form of decoupledlayers from the substrate material, and which have be<strong>en</strong> rec<strong>en</strong>tlydiscovered in scanning tunnelling experim<strong>en</strong>ts [G.Li et al., Phys. Rev. Lett. 103, 176804 (2009)]. Probingsuch flakes in the THz range at very low magnetic fields, wedemonstrate a superior electronic quality of these ultra lowd<strong>en</strong>sity layers (n 0 ≈ 3×10 9 cm −2 ) expressed by the carriermobility in excess of 10 7 cm 2 /(V.s) or scattering time ofτ ≈ 20 ps. These values significantly exceed those reportedin any kind of manmade graph<strong>en</strong>e samples.The cyclotron resonance of electrons in these graph<strong>en</strong>eflakes has be<strong>en</strong> measured in a high-frequ<strong>en</strong>cy electron paramagneticresonance setup in double-pass transmission configuration,using the magnetic-field-modulation technique.A flake of natural graphite was placed in the variable temperatureinsert of the superconducting sol<strong>en</strong>oid and viaquasi-optics exposed to the linearly polarized microwaveradiation emitted by a Gun diode.A typical example of our experim<strong>en</strong>tal finding is illustratedin figure 19a, where the derivative of the magnetoabsorptionspectrum of decoupled graph<strong>en</strong>e on the surfaceof a natural graphite specim<strong>en</strong> at T = 25 K, measured asa function of the magnetic field at a fixed microwave frequ<strong>en</strong>cy.The interpretation is schematically illustrated inpart (b). The observed spectral lines are assigned to cyclotronresonance transitions betwe<strong>en</strong> adjac<strong>en</strong>t Landau levelswith <strong>en</strong>ergies: E n = sign(n)˜c √ 2eB|n|, characteristicof massless Dirac fermions in graph<strong>en</strong>e sheets with an effectiveFermi velocity ˜c. This velocity is the only adjustableparameter required to match the <strong>en</strong>ergies of theobserved and calculated CR transitions and reaches ˜c =(1.00 ± 0.02) × 10 6 m.s −1 .Since the well-defined Landau level quantization in ourgraph<strong>en</strong>e flakes is spotted down to |B| = 1 mT we obtainvia the semi-classical quantization condition µB > 1 thecarrier mobility µ > 10 7 cm 2 /(V.s), almost two orders ofmagnitude higher in comparison to any other reported values.The scattering time τ ≈ 20 ps derived from the typicalCR width in our spectra also significantly exceeds valuesreported in any kind of graph<strong>en</strong>e samples. This scatteringtime gives an indep<strong>en</strong>d<strong>en</strong>t estimation for the mobilityµ = eτ ˜c 2 /E F ≈ 3 × 10 7 cm 2 /(V.s) in good agreem<strong>en</strong>twith the estimate above. Interestingly, bearing in mindthis exceptional quality, one may conclude that Landaulevel quantization should survive in studied graph<strong>en</strong>e layersdown to the field of B = (/(E 1 · τ)) 2 ≈ 1 µT. H<strong>en</strong>ce,the magnetic field of the Earth of ∼ 50 µT is no longer negligiblysmall. Instead, the <strong>en</strong>ergy gap up to ∆ ≈ 0.3 meVshould appear at the Dirac point, dep<strong>en</strong>ding on the sampleori<strong>en</strong>tation.Figure 19: (Derivative of) a typical magneto-absorptionspectrum measured at T = 25 K and microwave frequ<strong>en</strong>cyω = 1.171 meV (a) in comparison with the Landau level fanchart (b), where the observed CR transitions are shown by arrows.The occupation of individual levels is giv<strong>en</strong> by the Fermi-Diracdistribution plotted in the part (c). For simplicity, we consideredonly n-type doping with E F = 6.5 meV. The dashed lines showpositions of resonances assuming ˜c = 1.00 × 10 6 m.s −1 .Moreover, the estimated mobility should not decrease withtemperature, as no broad<strong>en</strong>ing of CRs is observed up toT = 50 K, wh<strong>en</strong> CR int<strong>en</strong>sities become comparable withthe noise. This extremely high value of mobility combinestwo effects: the long scattering time τ and a very small effectivemass m = E F / ˜c 2 ≈ 2 × 10 −4 m 0 E F [meV]. Remarkably,the same scattering time in a moderate d<strong>en</strong>sity sample(n 0 = 10 11 cm −2 ), would imply the mobility still remaininghigh, around µ ≈ 5×10 6 cm 2 /(V.s), and comparable to bestmobilities of two-dim<strong>en</strong>sional electron gas in GaAs structuresat these d<strong>en</strong>sities.To conclude, our measurem<strong>en</strong>t significantly shifts the curr<strong>en</strong>tlimits of intrinsic mobility in graph<strong>en</strong>e and poses aquest for further developm<strong>en</strong>t in the technology of its fabrication.For details see, P. Neugebauer et al., Phys. Rev. Lett. 103,136403 (2009).P. Neugebauer, M. Orlita, C. Faugeras, A.-L. Barra, M. Potemski15
CARBON ALLOTROPES 2009Effect of a magnetic field on the two-phonon Raman scattering in graph<strong>en</strong>eAmong the differ<strong>en</strong>t features that can be observed in theRaman scattering spectrum of graph<strong>en</strong>e or graphite, theso-called 2D band feature is of particular interest. It is afully resonant second order Raman scattering process anddirectly involves the electronic band structure. Its observationas a single Lor<strong>en</strong>tzian shaped contribution is a uniquefingerprint of the monolayer character of a graph<strong>en</strong>e specim<strong>en</strong>or of the decoupled nature of the graphitic planes inmultilayer epitaxial graph<strong>en</strong>e samples. As a fully resonantsecond order Raman scattering process, it shows a dispersionwith excitation laser <strong>en</strong>ergy which was used to tracethe phonon band structure of differ<strong>en</strong>t carbon allotropes.We have measured the evolution of the 2D band feature ofa multilayer epitaxial graph<strong>en</strong>e sample as a function of themagnetic field with the experim<strong>en</strong>tal set-up and in the sameconfiguration as is <strong>des</strong>cribed in the preceding report. As canbe se<strong>en</strong> with the black dots in the left part of figure 20, fromB=0 to 33 T we observe first a quadratic and th<strong>en</strong> a linearcontinuous red shift of the <strong>en</strong>ergy of this feature (8 cm −1 )together with a broad<strong>en</strong>ing of 20%.As can be se<strong>en</strong> in the schematics in the right part of figure20, in the semi-classical real-space picture of the Ramanprocess, the incid<strong>en</strong>t photon creates an electron and thehole with opposite mom<strong>en</strong>ta at an arbitrary location withinthe laser spot. They subsequ<strong>en</strong>tly propagate along the classicaltrajectories, and emit phonons. If they meet at someother location, again with opposite mom<strong>en</strong>ta, they can recombineradiatively producing a scattered photon. In theabs<strong>en</strong>ce of magnetic field, the trajectories are straight lines,so that in order to meet at the same point with opposite mom<strong>en</strong>taand contribute to the Raman signal, during phononemission the electron and the hole must necessarily be scatteredbackwards. This fixes the phonon mom<strong>en</strong>tum q(measured from the K or K ′ point) as q = p + p ′ , wherep = ω L /(2c∗) and p ′ = (ω L − 2ω ph )/(2c∗) are theelectronic mom<strong>en</strong>ta (also measured from the Dirac points)before and after the phonon emission, ω L and ω ph are respectivelythe excitation laser and the phonon frequ<strong>en</strong>cies,and c∗ is the electron velocity.In a magnetic field, the electron and hole trajectories ar<strong>en</strong>o longer straight lines but, because of the Lor<strong>en</strong>tz forcethat acts on charged particles in a magnetic field, they correspondto Larmor circles. As a result, (i) phonons withsmaller mom<strong>en</strong>ta, q = pcosϕ + p ′ cosϕ ′ , can be emitted,and (ii) since each phonon can be emitted at an arbitraryinstant in time, the l<strong>en</strong>gth of the arc <strong>des</strong>cribing the electrontrajectory is random [not exceeding the electron meanfree path c ∗ /(2γ), where γ is the electron scattering rate],and so are the angles ϕ,ϕ ′ . Tuning the magnetic field is,in this s<strong>en</strong>se, equival<strong>en</strong>t to changing the resonant conditionsof the Raman scattering process at a fixed excitationwavel<strong>en</strong>gth and allows spanning part of the phonon bandstructure closer to the K point. Fact (i) results in an overallred shift of the Raman peak, while fact (ii) introduces anadditional spread in q, and contributes significantly to thebroad<strong>en</strong>ing of the peak as observed through Raman scatteringmeasurem<strong>en</strong>ts.The solid red lines in figure 20 are the result of a calculationof the maximum Raman scattering int<strong>en</strong>sities as a functionof magnetic field following our model calculating the Ramanmatrix elem<strong>en</strong>t with an applied magnetic field and withthe assumption that Landau levels at the excitation laser <strong>en</strong>ergyare not separated (non-quantizing magnetic fields forhigh <strong>en</strong>ergy charge carriers). Experim<strong>en</strong>tal results are wellreproduced with only two adjustable parameters, the electronscattering rate deduced to be γ = 27 meV and σ, abroad<strong>en</strong>ing parameter introduced to take into account scatteringmechanisms other than electronic scattering and responsiblefor half of the observed total broad<strong>en</strong>ing. Thisfield induced 2D band feature evolution is not typical forgraph<strong>en</strong>e and should also be observed in graphite.Figure 20: Left: Black dots are the 2D band feature Raman shiftand line width as a function of the magnetic field and solid redlines are calculated with our model. Right: Real space schematicsof the second order Raman scattering process responsible for the2D band at B=0T and B≠0T. The lightning is the excitation laserwith <strong>en</strong>ergy E L , black arrows repres<strong>en</strong>t the electron and hole trajectorieswith mom<strong>en</strong>tum p (-p) before the phonon emission andp’ (-p’) after, dashed gre<strong>en</strong> arrows are the K point optical phononswith mom<strong>en</strong>tum q and <strong>en</strong>ergy E(q), the flash is the emission of theRaman photon.C. Faugeras, P. Kossacki, M. Amado, M. PotemskiD. Basko (LPMMC-CNRS, Gr<strong>en</strong>oble, France), M. Sprinkle, C. Berger, W.A. de Heer (Georgia Institute of Technology,Atlanta, USA)16
- Page 1 and 2: LABORATOIRE NATIONAL DES CHAMPS MAG
- Page 4 and 5: TABLE OF CONTENTSPreface 1Carbon Al
- Page 6 and 7: Coexistence of closed orbit and qua
- Page 8: 2009PrefaceDear Reader,You have bef
- Page 12 and 13: 2009 CARBON ALLOTROPESInvestigation
- Page 14 and 15: 2009 CARBON ALLOTROPESPropagative L
- Page 16 and 17: 2009 CARBON ALLOTROPESEdge fingerpr
- Page 18 and 19: 2009 CARBON ALLOTROPESObservation o
- Page 20 and 21: 2009 CARBON ALLOTROPESImproving gra
- Page 24 and 25: 2009 CARBON ALLOTROPESTuning the el
- Page 26 and 27: 2009 CARBON ALLOTROPESElectric fiel
- Page 28 and 29: 2009 CARBON ALLOTROPESMagnetotransp
- Page 30 and 31: 2009 CARBON ALLOTROPESGraphite from
- Page 32: 2009Two-Dimensional Electron Gas25
- Page 35 and 36: TWO-DIMENSIONAL ELECTRON GAS 2009Di
- Page 37 and 38: TWO-DIMENSIONAL ELECTRON GAS 2009Sp
- Page 39 and 40: TWO-DIMENSIONAL ELECTRON GAS 2009Cr
- Page 41 and 42: TWO-DIMENSIONAL ELECTRON GAS 2009Re
- Page 43 and 44: TWO-DIMENSIONAL ELECTRON GAS 2009In
- Page 45 and 46: TWO-DIMENSIONAL ELECTRON GAS 2009Ho
- Page 47 and 48: TWO-DIMENSIONAL ELECTRON GAS 2009Te
- Page 50 and 51: 2009 SEMICONDUCTORS AND NANOSTRUCTU
- Page 52 and 53: 2009 SEMICONDUCTORS AND NANOSTRUCTU
- Page 54 and 55: 2009 SEMICONDUCTORS AND NANOSTRUCTU
- Page 56 and 57: 2009 SEMICONDUCTORS AND NANOSTRUCTU
- Page 58 and 59: 2009 SEMICONDUCTORS AND NANOSTRUCTU
- Page 60: 2009Metals, Superconductors and Str
- Page 63 and 64: METALS, SUPERCONDUCTORS... 2009Anom
- Page 65 and 66: METALS, SUPERCONDUCTORS... 2009Magn
- Page 67 and 68: METALS, SUPERCONDUCTORS ... 2009Coe
- Page 69 and 70: METALS, SUPERCONDUCTORS ... 2009Fie
- Page 71 and 72: METALS, SUPERCONDUCTORS... 2009High
- Page 73 and 74:
METALS, SUPERCONDUCTORS... 2009Angu
- Page 75 and 76:
METALS, SUPERCONDUCTORS... 2009Magn
- Page 77 and 78:
METALS, SUPERCONDUCTORS... 2009Meta
- Page 79 and 80:
METALS, SUPERCONDUCTORS... 2009Temp
- Page 81 and 82:
METALS, SUPERCONDUCTORS... 200974
- Page 84 and 85:
2009 MAGNETIC SYSTEMSY b 3+ → Er
- Page 86 and 87:
2009 MAGNETIC SYSTEMSMagnetotranspo
- Page 88 and 89:
2009 MAGNETIC SYSTEMSHigh field tor
- Page 90 and 91:
2009 MAGNETIC SYSTEMSNuclear magnet
- Page 92 and 93:
2009 MAGNETIC SYSTEMSStructural ana
- Page 94 and 95:
2009 MAGNETIC SYSTEMSEnhancement ma
- Page 96 and 97:
2009 MAGNETIC SYSTEMSInvestigation
- Page 98 and 99:
2009 MAGNETIC SYSTEMSField-induced
- Page 100 and 101:
2009 MAGNETIC SYSTEMSMagnetic prope
- Page 102:
2009Biology, Chemistry and Soft Mat
- Page 105 and 106:
BIOLOGY, CHEMISTRY AND SOFT MATTER
- Page 108 and 109:
2009 APPLIED SUPERCONDUCTIVITYMagne
- Page 110 and 111:
2009 APPLIED SUPERCONDUCTIVITYPhtha
- Page 112:
2009Magneto-Science105
- Page 115 and 116:
MAGNETO-SCIENCE 2009Study of the in
- Page 117 and 118:
MAGNETO-SCIENCE 2009Magnetohydrodyn
- Page 119 and 120:
MAGNETO-SCIENCE 2009112
- Page 122 and 123:
2009 MAGNET DEVELOPMENT AND INSTRUM
- Page 124 and 125:
2009 MAGNET DEVELOPMENT AND INSTRUM
- Page 126 and 127:
2009 MAGNET DEVELOPMENT AND INSTRUM
- Page 128 and 129:
2009 MAGNET DEVELOPMENT AND INSTRUM
- Page 130 and 131:
2009 MAGNET DEVELOPMENT AND INSTRUM
- Page 132 and 133:
2009 MAGNET DEVELOPMENT AND INSTRUM
- Page 134 and 135:
2009 MAGNET DEVELOPMENT AND INSTRUM
- Page 136 and 137:
2009 PROPOSALSProposals for Magnet
- Page 138 and 139:
2009 PROPOSALSSpin-Jahn-Teller effe
- Page 140 and 141:
2009 PROPOSALSQuantum Oscillations
- Page 142 and 143:
2009 PROPOSALSThermoelectric tensor
- Page 144 and 145:
2009 PROPOSALSDr. EscoffierCyclotro
- Page 146 and 147:
2009 PROPOSALSHigh field magnetotra
- Page 148 and 149:
2009 THESESPhD Theses 20091. Nanot
- Page 150 and 151:
2009 PUBLICATIONS[21] O. Drachenko,
- Page 152 and 153:
2009 PUBLICATIONS[75] S. Nowak, T.
- Page 154 and 155:
Contributors of the LNCMI to the Pr
- Page 156 and 157:
Institut Jean Lamour, Nancy : 68Ins
- Page 158 and 159:
Lawrence Berkeley National Laborato