2009 TWO-DIMENSIONAL ELECTRON GASThe surprisingly fragile quantum Hall ferromagnet at filling factor ν = 1In two dim<strong>en</strong>sions many body interactions oft<strong>en</strong> dominateover the single particle physics giving rise to novel collectiveground states. A striking example is the quantum Hallferromagnet. At filling factor ν = 1, the lowest Landau levelis half empty so that all the electrons have the same orbitalquantum number and only the spin degree of freedom remains.The ground state is predicted to be an extremelyrobust itinerant quantum Hall ferromagnet with a gap forspin excitations greatly exceeding the single particle Zeeman<strong>en</strong>ergy. On the other hand, either side of ν = 1 thesystem depolarizes more rapidly than predicted by the singleparticle picture, due to the formation of spin textures(Skyrmions or anti-Skyrmions) in the ground state.wave) excitation spectrum. This prediction, shown by thedot-dashed line largely overestimates the robustness of theν = 1 quantum Hall ferromagnet. Intriguingly, the predictedspin polarization calculated for two spin levels separatedby the bare Zeeman <strong>en</strong>ergy, gµ B B ≃ 2.1 K, plottedas a dashed line coinci<strong>des</strong> much better with our data. Ourresults suggest that the itinerant quantum Hall ferromagnetat ν = 1 is not robust, and collapses, wh<strong>en</strong>ever possible,to a lower <strong>en</strong>ergy ground state with a large number of reversedspins [Plochocka et al. Phys. Rev. Lett. 102, 126806(2009)].To measure the absorption spectrum of a single GaAs quantumwell (QW) at low temperatures we have used a structurewhich forms a half-cavity for the incoming light withthe QW located at the anti-node of the standing waveformed by the optical field. In figure 33(a) we plot the integratedint<strong>en</strong>sity of the absorption to the n = 0 Landau levelfor both circular polarizations as a function of filling factor.For both polarizations (σ + and σ − ) the absorption is nonzero over almost all the range 0 < ν < 2. This implies thatthe upper Zeeman (UZ) and lower Zeeman (UZ) levels arealmost never fully occupied. However, for the absorptionto the lower Zeeman (LZ) level a sharp minimum (zero) atν = 1 is observed.The spin polarization of the 2DEG can be obtained directlyfrom the optical dichroism shown in figure 33(b). The measuredpolarization at T = 1.6 K is comparable with previousabsorption and reflectivity measurem<strong>en</strong>ts, the spin polarizationsaturates at approximately 0.8 and the depolarizationon both si<strong>des</strong> of ν = 1 is roughly symmetric and compatiblewith the formation of spin textures (Skyrmions or anti-Skyrmions) in the ground state of size S ≈ A ≈ 3. At verylow temperature (T = 40 mK), the system does indeed fullypolarize within experim<strong>en</strong>tal error (∼ 0.97) at exactly fillingfactor ν = 1, and that this feature is extremely sharpwith a width of only δν ≈ 0.01 (figure.33(c)). The fully polarizedstate is a signature of the quantum Hall ferromagnetat filling factor ν = 1 while the sharp depolarization observedeither side of ν = 1 corresponds to ≈ 15 spin flipsper magnetic flux quanta added or removed from the system,consist<strong>en</strong>t with the formation of a lower <strong>en</strong>ergy spintexture (skyrmion or anti-skyrmion) ground state either sideof ν = 1.It is extremely surprising that a temperature of a few hundredmK is already suffici<strong>en</strong>t to suppress full spin polarization(figure.33(d)). The thermodynamics of the ν = 1quantum Hall ferromagnet should be governed by thermalactivation to the continuum of the spin-exciton (spinFigure 33: (a) Integrated int<strong>en</strong>sity (I σ ±) of the absorption tothe n = 0 Landau level measured for both σ + and σ − polarizationsas a function of filling factor. (b) optical dichroism,(I σ − − I σ +)/(I σ − + I σ +) (spin polarization). The calculated depolarizationfor finite size skyrmions/anti-skyrmions (A=S=3) and(A=S=15) is shown. (c) spin polarization around filling factorν = 1 measured at T=40, 500 mK and 1.6 K. (d) detailed temperaturedep<strong>en</strong>d<strong>en</strong>ce of the spin polarization at exactly ν = 1 (thesolid line is drawn as a guide to the eye). Brok<strong>en</strong> lines show thepredicted temperature dep<strong>en</strong>d<strong>en</strong>ce of the polarization for a spinwave excitation and for two spin levels separated by the singleparticle Zeeman <strong>en</strong>ergy.P. Plochocka, J. M. Schneider, D. K. Maude, M. PotemskiM. Rappaport, V. Umansky, I. Bar-Joseph (Weizmann Institute, Israel), J. G. Groshaus, Y. Gallais, A. Pinczuk(Columbia University, New York)27
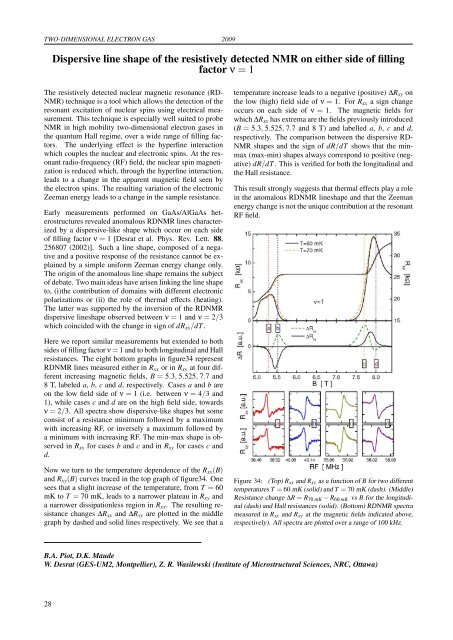
TWO-DIMENSIONAL ELECTRON GAS 2009Dispersive line shape of the resistively detected NMR on either side of fillingfactor ν = 1The resistively detected nuclear magnetic resonance (RD-NMR) technique is a tool which allows the detection of theresonant excitation of nuclear spins using electrical measurem<strong>en</strong>t.This technique is especially well suited to probeNMR in high mobility two-dim<strong>en</strong>sional electron gases inthe quantum Hall regime, over a wide range of filling factors.The underlying effect is the hyperfine interactionwhich couples the nuclear and electronic spins. At the resonantradio-frequ<strong>en</strong>cy (RF) field, the nuclear spin magnetizationis reduced which, through the hyperfine interaction,leads to a change in the appar<strong>en</strong>t magnetic field se<strong>en</strong> bythe electron spins. The resulting variation of the electronicZeeman <strong>en</strong>ergy leads to a change in the sample resistance.Early measurem<strong>en</strong>ts performed on GaAs/AlGaAs heterostructuresrevealed anomalous RDNMR lines characterizedby a dispersive-like shape which occur on each sideof filling factor ν = 1 [Desrat et al. Phys. Rev. Lett. 88,256807 (2002)]. Such a line shape, composed of a negativeand a positive response of the resistance cannot be explainedby a simple uniform Zeeman <strong>en</strong>ergy change only.The origin of the anomalous line shape remains the subjectof debate. Two main ideas have aris<strong>en</strong> linking the line shapeto, (i)the contribution of domains with differ<strong>en</strong>t electronicpolarizations or (ii) the role of thermal effects (heating).The latter was supported by the inversion of the RDNMRdispersive lineshape observed betwe<strong>en</strong> ν = 1 and ν = 2/3which coincided with the change in sign of dR xx /dT .temperature increase leads to a negative (positive) ∆R xy onthe low (high) field side of ν = 1. For R xx a sign changeoccurs on each side of ν = 1. The magnetic fields forwhich ∆R xx has extrema are the fields previously introduced(B = 5.3, 5.525, 7.7 and 8 T) and labelled a, b, c and d,respectively. The comparison betwe<strong>en</strong> the dispersive RD-NMR shapes and the sign of dR/dT shows that the minmax(max-min) shapes always correspond to positive (negative)dR/dT . This is verified for both the longitudinal andthe Hall resistance.This result strongly suggests that thermal effects play a rolein the anomalous RDNMR lineshape and that the Zeeman<strong>en</strong>ergy change is not the unique contribution at the resonantRF field.Here we report similar measurem<strong>en</strong>ts but ext<strong>en</strong>ded to bothsi<strong>des</strong> of filling factor ν = 1 and to both longitudinal and Hallresistances. The eight bottom graphs in figure34 repres<strong>en</strong>tRDNMR lines measured either in R xx or in R xy at four differ<strong>en</strong>tincreasing magnetic fields, B = 5.3, 5.525, 7.7 and8 T, labeled a, b, c and d, respectively. Cases a and b areon the low field side of ν = 1 (i.e. betwe<strong>en</strong> ν = 4/3 and1), while cases c and d are on the high field side, towardsν = 2/3. All spectra show dispersive-like shapes but someconsist of a resistance minimum followed by a maximumwith increasing RF, or inversely a maximum followed bya minimum with increasing RF. The min-max shape is observedin R xx for cases b and c and in R xy for cases c andd.Now we turn to the temperature dep<strong>en</strong>d<strong>en</strong>ce of the R xx (B)and R xy (B) curves traced in the top graph of figure34. Onesees that a slight increase of the temperature, from T = 60mK to T = 70 mK, leads to a narrower plateau in R xy anda narrower dissipationless region in R xx . The resulting resistancechanges ∆R xx and ∆R xy are plotted in the middlegraph by dashed and solid lines respectively. We see that aFigure 34: (Top) R xx and R xy as a function of B for two differ<strong>en</strong>ttemperatures T = 60 mK (solid) and T = 70 mK (dash). (Middle)Resistance change ∆R = R 70 mK − R 60 mK vs B for the longitudinal(dash) and Hall resistances (solid). (Bottom) RDNMR spectrameasured in R xx and R xy at the magnetic fields indicated above,respectively). All spectra are plotted over a range of 100 kHz.B.A. Piot, D.K. MaudeW. Desrat (GES-UM2, Montpellier), Z. R. Wasilewski (Institute of Microstructural Sci<strong>en</strong>ces, NRC, Ottawa)28
- Page 1 and 2: LABORATOIRE NATIONAL DES CHAMPS MAG
- Page 4 and 5: TABLE OF CONTENTSPreface 1Carbon Al
- Page 6 and 7: Coexistence of closed orbit and qua
- Page 8: 2009PrefaceDear Reader,You have bef
- Page 12 and 13: 2009 CARBON ALLOTROPESInvestigation
- Page 14 and 15: 2009 CARBON ALLOTROPESPropagative L
- Page 16 and 17: 2009 CARBON ALLOTROPESEdge fingerpr
- Page 18 and 19: 2009 CARBON ALLOTROPESObservation o
- Page 20 and 21: 2009 CARBON ALLOTROPESImproving gra
- Page 22 and 23: 2009 CARBON ALLOTROPESHow perfect c
- Page 24 and 25: 2009 CARBON ALLOTROPESTuning the el
- Page 26 and 27: 2009 CARBON ALLOTROPESElectric fiel
- Page 28 and 29: 2009 CARBON ALLOTROPESMagnetotransp
- Page 30 and 31: 2009 CARBON ALLOTROPESGraphite from
- Page 32: 2009Two-Dimensional Electron Gas25
- Page 37 and 38: TWO-DIMENSIONAL ELECTRON GAS 2009Sp
- Page 39 and 40: TWO-DIMENSIONAL ELECTRON GAS 2009Cr
- Page 41 and 42: TWO-DIMENSIONAL ELECTRON GAS 2009Re
- Page 43 and 44: TWO-DIMENSIONAL ELECTRON GAS 2009In
- Page 45 and 46: TWO-DIMENSIONAL ELECTRON GAS 2009Ho
- Page 47 and 48: TWO-DIMENSIONAL ELECTRON GAS 2009Te
- Page 50 and 51: 2009 SEMICONDUCTORS AND NANOSTRUCTU
- Page 52 and 53: 2009 SEMICONDUCTORS AND NANOSTRUCTU
- Page 54 and 55: 2009 SEMICONDUCTORS AND NANOSTRUCTU
- Page 56 and 57: 2009 SEMICONDUCTORS AND NANOSTRUCTU
- Page 58 and 59: 2009 SEMICONDUCTORS AND NANOSTRUCTU
- Page 60: 2009Metals, Superconductors and Str
- Page 63 and 64: METALS, SUPERCONDUCTORS... 2009Anom
- Page 65 and 66: METALS, SUPERCONDUCTORS... 2009Magn
- Page 67 and 68: METALS, SUPERCONDUCTORS ... 2009Coe
- Page 69 and 70: METALS, SUPERCONDUCTORS ... 2009Fie
- Page 71 and 72: METALS, SUPERCONDUCTORS... 2009High
- Page 73 and 74: METALS, SUPERCONDUCTORS... 2009Angu
- Page 75 and 76: METALS, SUPERCONDUCTORS... 2009Magn
- Page 77 and 78: METALS, SUPERCONDUCTORS... 2009Meta
- Page 79 and 80: METALS, SUPERCONDUCTORS... 2009Temp
- Page 81 and 82: METALS, SUPERCONDUCTORS... 200974
- Page 84 and 85:
2009 MAGNETIC SYSTEMSY b 3+ → Er
- Page 86 and 87:
2009 MAGNETIC SYSTEMSMagnetotranspo
- Page 88 and 89:
2009 MAGNETIC SYSTEMSHigh field tor
- Page 90 and 91:
2009 MAGNETIC SYSTEMSNuclear magnet
- Page 92 and 93:
2009 MAGNETIC SYSTEMSStructural ana
- Page 94 and 95:
2009 MAGNETIC SYSTEMSEnhancement ma
- Page 96 and 97:
2009 MAGNETIC SYSTEMSInvestigation
- Page 98 and 99:
2009 MAGNETIC SYSTEMSField-induced
- Page 100 and 101:
2009 MAGNETIC SYSTEMSMagnetic prope
- Page 102:
2009Biology, Chemistry and Soft Mat
- Page 105 and 106:
BIOLOGY, CHEMISTRY AND SOFT MATTER
- Page 108 and 109:
2009 APPLIED SUPERCONDUCTIVITYMagne
- Page 110 and 111:
2009 APPLIED SUPERCONDUCTIVITYPhtha
- Page 112:
2009Magneto-Science105
- Page 115 and 116:
MAGNETO-SCIENCE 2009Study of the in
- Page 117 and 118:
MAGNETO-SCIENCE 2009Magnetohydrodyn
- Page 119 and 120:
MAGNETO-SCIENCE 2009112
- Page 122 and 123:
2009 MAGNET DEVELOPMENT AND INSTRUM
- Page 124 and 125:
2009 MAGNET DEVELOPMENT AND INSTRUM
- Page 126 and 127:
2009 MAGNET DEVELOPMENT AND INSTRUM
- Page 128 and 129:
2009 MAGNET DEVELOPMENT AND INSTRUM
- Page 130 and 131:
2009 MAGNET DEVELOPMENT AND INSTRUM
- Page 132 and 133:
2009 MAGNET DEVELOPMENT AND INSTRUM
- Page 134 and 135:
2009 MAGNET DEVELOPMENT AND INSTRUM
- Page 136 and 137:
2009 PROPOSALSProposals for Magnet
- Page 138 and 139:
2009 PROPOSALSSpin-Jahn-Teller effe
- Page 140 and 141:
2009 PROPOSALSQuantum Oscillations
- Page 142 and 143:
2009 PROPOSALSThermoelectric tensor
- Page 144 and 145:
2009 PROPOSALSDr. EscoffierCyclotro
- Page 146 and 147:
2009 PROPOSALSHigh field magnetotra
- Page 148 and 149:
2009 THESESPhD Theses 20091. Nanot
- Page 150 and 151:
2009 PUBLICATIONS[21] O. Drachenko,
- Page 152 and 153:
2009 PUBLICATIONS[75] S. Nowak, T.
- Page 154 and 155:
Contributors of the LNCMI to the Pr
- Page 156 and 157:
Institut Jean Lamour, Nancy : 68Ins
- Page 158 and 159:
Lawrence Berkeley National Laborato