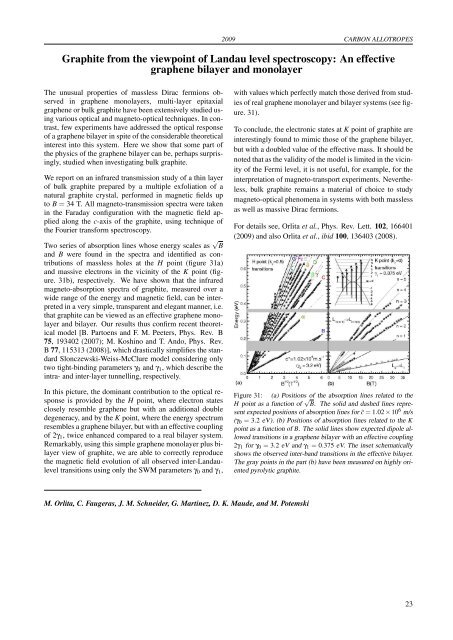
2009 CARBON ALLOTROPESGraphite from the viewpoint of Landau level spectroscopy: An effectivegraph<strong>en</strong>e bilayer and monolayerThe unusual properties of massless Dirac fermions observedin graph<strong>en</strong>e monolayers, multi-layer epitaxialgraph<strong>en</strong>e or bulk graphite have be<strong>en</strong> ext<strong>en</strong>sively studied usingvarious optical and magneto-optical techniques. In contrast,few experim<strong>en</strong>ts have addressed the optical responseof a graph<strong>en</strong>e bilayer in spite of the considerable theoreticalinterest into this system. Here we show that some part ofthe physics of the graph<strong>en</strong>e bilayer can be, perhaps surprisingly,studied wh<strong>en</strong> investigating bulk graphite.We report on an infrared transmission study of a thin layerof bulk graphite prepared by a multiple exfoliation of anatural graphite crystal, performed in magnetic fields upto B = 34 T. All magneto-transmission spectra were tak<strong>en</strong>in the Faraday configuration with the magnetic field appliedalong the c-axis of the graphite, using technique ofthe Fourier transform spectroscopy.Two series of absorption lines whose <strong>en</strong>ergy scales as √ Band B were found in the spectra and id<strong>en</strong>tified as contributionsof massless holes at the H point (figure 31a)and massive electrons in the vicinity of the K point (figure.31b), respectively. We have shown that the infraredmagneto-absorption spectra of graphite, measured over awide range of the <strong>en</strong>ergy and magnetic field, can be interpretedin a very simple, transpar<strong>en</strong>t and elegant manner, i.e.that graphite can be viewed as an effective graph<strong>en</strong>e monolayerand bilayer. Our results thus confirm rec<strong>en</strong>t theoreticalmodel [B. Parto<strong>en</strong>s and F. M. Peeters, Phys. Rev. B75, 193402 (2007); M. Koshino and T. Ando, Phys. Rev.B 77, 115313 (2008)], which drastically simplifies the standardSlonczewski-Weiss-McClure model considering onlytwo tight-binding parameters γ 0 and γ 1 , which <strong>des</strong>cribe theintra- and inter-layer tunnelling, respectively.In this picture, the dominant contribution to the optical responseis provided by the H point, where electron statesclosely resemble graph<strong>en</strong>e but with an additional doubledeg<strong>en</strong>eracy, and by the K point, where the <strong>en</strong>ergy spectrumresembles a graph<strong>en</strong>e bilayer, but with an effective couplingof 2γ 1 , twice <strong>en</strong>hanced compared to a real bilayer system.Remarkably, using this simple graph<strong>en</strong>e monolayer plus bilayerview of graphite, we are able to correctly reproducethe magnetic field evolution of all observed inter-Landauleveltransitions using only the SWM parameters γ 0 and γ 1 ,with values which perfectly match those derived from studiesof real graph<strong>en</strong>e monolayer and bilayer systems (see figure.31).To conclude, the electronic states at K point of graphite areinterestingly found to mimic those of the graph<strong>en</strong>e bilayer,but with a doubled value of the effective mass. It should b<strong>en</strong>oted that as the validity of the model is limited in the vicinityof the Fermi level, it is not useful, for example, for theinterpretation of magneto-transport experim<strong>en</strong>ts. Nevertheless,bulk graphite remains a material of choice to studymagneto-optical ph<strong>en</strong>om<strong>en</strong>a in systems with both masslessas well as massive Dirac fermions.For details see, Orlita et al., Phys. Rev. Lett. 102, 166401(2009) and also Orlita et al., ibid 100, 136403 (2008).Figure 31: (a) Positions of the absorption lines related to theH point as a function of √ B. The solid and dashed lines repres<strong>en</strong>texpected positions of absorption lines for ˜c = 1.02 × 10 6 m/s(γ 0 = 3.2 eV). (b) Positions of absorption lines related to the Kpoint as a function of B. The solid lines show expected dipole allowedtransitions in a graph<strong>en</strong>e bilayer with an effective coupling2γ 1 for γ 0 = 3.2 eV and γ 1 = 0.375 eV. The inset schematicallyshows the observed inter-band transitions in the effective bilayer.The gray points in the part (b) have be<strong>en</strong> measured on highly ori<strong>en</strong>tedpyrolytic graphite.M. Orlita, C. Faugeras, J. M. Schneider, G. Martinez, D. K. Maude, and M. Potemski23
CARBON ALLOTROPES 2009Magneto-transmission of multi-layer epitaxial graph<strong>en</strong>e and bulk graphite:A comparisonThe fabrication of multi-layer epitaxial graph<strong>en</strong>e on thecarbon-terminated surface of SiC crystal [see e.g. W. A.de Heer et al., Solid State Commun. 143, 92 (2007)], withthe characteristic rotational stacking of graph<strong>en</strong>e sheets [J.Hass et al., Phys. Rev. Lett. 100, 125504 (2008)], naturallyinduced live discussions about differ<strong>en</strong>ces in electronicband structures of this system and well-known bulkgraphite, which has be<strong>en</strong> int<strong>en</strong>sively studied within lastsixty years.Here we report on magneto-transmission measurem<strong>en</strong>ts inthe far infrared spectral range, performed to help in understandingof electronic band structures of both these materials.In our study, we have compared magneto-optical responseof two kinds of samples: Multi-layer graph<strong>en</strong>e sample,which was epitaxially grown by thermal decompositionon the carbon-terminated surface of a 4H-SiC substrate andcontains around ∼100 graph<strong>en</strong>e layers, and a thin layer ofbulk graphite (single-crystal natural graphite), prepared bya simple exfoliation using an adhesive tape. Typical lowmagnetic-fielddata obtained in our experim<strong>en</strong>t are shownin Fig. 32.In our magneto-transmission measurem<strong>en</strong>ts, we have focusedon spectral features evolving linearly with √ B, whichrepres<strong>en</strong>t a hallmark of massless Dirac fermions pres<strong>en</strong>taround K and H points in graph<strong>en</strong>e and graphite, respectively.The magneto-optical response of both materialswas found to be surprisingly similar and practically thesame Fermi velocity has be<strong>en</strong> extracted from data, ˜c =1.02 × 10 6 m.s −1 . Nevertheless, the obtained data still allowedus to distinguish betwe<strong>en</strong> (strongly anisotropic) 3Dbulk graphite and 2D multi-layer epitaxial graph<strong>en</strong>e. The3D nature of bulk graphite was mainly demonstrated viaappearance of an additional set of absorption lines (d<strong>en</strong>otedby Greek letters in Fig. 32b) in comparison to multilayergraph<strong>en</strong>e. H<strong>en</strong>ce, whereas the results obtained onmulti-layer graph<strong>en</strong>e fully corresponded to expectations fordipole-allowed transitions in a 2D gas of massless Diracfermions, the transmission spectra tak<strong>en</strong> on bulk graphiteappeared to be more complex. The standard Slonczewski-Weiss-McClure model of the bulk graphite band structurewas found in latter case to be suffici<strong>en</strong>t to explain exist<strong>en</strong>ceof all absorption lines scaling as √ B as well and their individuallineshapes.For details see, M. Orlita et al., Solid State Commun. 149,1128 (2009).Figure 32: Transmissions spectra of multi-layer epitaxialgraph<strong>en</strong>e (a) and bulk graphite (b) for selected magnetic fields atT = 2 K. The absorption lines corresponding to dipole-allowedtransitions in graph<strong>en</strong>e are d<strong>en</strong>oted by Roman letters. Greek lettersare used for additional transitions which scale as √ B and areonly found in spectra tak<strong>en</strong> on bulk graphite. For clarity, the spectrain part (a) and (b) were shifted by amount of 0.18 and 0.10,respectively.M. Orlita, C. Faugeras, G. Martinez, D. K. Maude, J. M. Schneider, M. PotemskiM. Sprinkle, C. Berger, W. A. de Heer (Georgia Institute of Technology, Atlanta, USA)24
- Page 1 and 2: LABORATOIRE NATIONAL DES CHAMPS MAG
- Page 4 and 5: TABLE OF CONTENTSPreface 1Carbon Al
- Page 6 and 7: Coexistence of closed orbit and qua
- Page 8: 2009PrefaceDear Reader,You have bef
- Page 12 and 13: 2009 CARBON ALLOTROPESInvestigation
- Page 14 and 15: 2009 CARBON ALLOTROPESPropagative L
- Page 16 and 17: 2009 CARBON ALLOTROPESEdge fingerpr
- Page 18 and 19: 2009 CARBON ALLOTROPESObservation o
- Page 20 and 21: 2009 CARBON ALLOTROPESImproving gra
- Page 22 and 23: 2009 CARBON ALLOTROPESHow perfect c
- Page 24 and 25: 2009 CARBON ALLOTROPESTuning the el
- Page 26 and 27: 2009 CARBON ALLOTROPESElectric fiel
- Page 28 and 29: 2009 CARBON ALLOTROPESMagnetotransp
- Page 32: 2009Two-Dimensional Electron Gas25
- Page 35 and 36: TWO-DIMENSIONAL ELECTRON GAS 2009Di
- Page 37 and 38: TWO-DIMENSIONAL ELECTRON GAS 2009Sp
- Page 39 and 40: TWO-DIMENSIONAL ELECTRON GAS 2009Cr
- Page 41 and 42: TWO-DIMENSIONAL ELECTRON GAS 2009Re
- Page 43 and 44: TWO-DIMENSIONAL ELECTRON GAS 2009In
- Page 45 and 46: TWO-DIMENSIONAL ELECTRON GAS 2009Ho
- Page 47 and 48: TWO-DIMENSIONAL ELECTRON GAS 2009Te
- Page 50 and 51: 2009 SEMICONDUCTORS AND NANOSTRUCTU
- Page 52 and 53: 2009 SEMICONDUCTORS AND NANOSTRUCTU
- Page 54 and 55: 2009 SEMICONDUCTORS AND NANOSTRUCTU
- Page 56 and 57: 2009 SEMICONDUCTORS AND NANOSTRUCTU
- Page 58 and 59: 2009 SEMICONDUCTORS AND NANOSTRUCTU
- Page 60: 2009Metals, Superconductors and Str
- Page 63 and 64: METALS, SUPERCONDUCTORS... 2009Anom
- Page 65 and 66: METALS, SUPERCONDUCTORS... 2009Magn
- Page 67 and 68: METALS, SUPERCONDUCTORS ... 2009Coe
- Page 69 and 70: METALS, SUPERCONDUCTORS ... 2009Fie
- Page 71 and 72: METALS, SUPERCONDUCTORS... 2009High
- Page 73 and 74: METALS, SUPERCONDUCTORS... 2009Angu
- Page 75 and 76: METALS, SUPERCONDUCTORS... 2009Magn
- Page 77 and 78: METALS, SUPERCONDUCTORS... 2009Meta
- Page 79 and 80: METALS, SUPERCONDUCTORS... 2009Temp
- Page 81 and 82:
METALS, SUPERCONDUCTORS... 200974
- Page 84 and 85:
2009 MAGNETIC SYSTEMSY b 3+ → Er
- Page 86 and 87:
2009 MAGNETIC SYSTEMSMagnetotranspo
- Page 88 and 89:
2009 MAGNETIC SYSTEMSHigh field tor
- Page 90 and 91:
2009 MAGNETIC SYSTEMSNuclear magnet
- Page 92 and 93:
2009 MAGNETIC SYSTEMSStructural ana
- Page 94 and 95:
2009 MAGNETIC SYSTEMSEnhancement ma
- Page 96 and 97:
2009 MAGNETIC SYSTEMSInvestigation
- Page 98 and 99:
2009 MAGNETIC SYSTEMSField-induced
- Page 100 and 101:
2009 MAGNETIC SYSTEMSMagnetic prope
- Page 102:
2009Biology, Chemistry and Soft Mat
- Page 105 and 106:
BIOLOGY, CHEMISTRY AND SOFT MATTER
- Page 108 and 109:
2009 APPLIED SUPERCONDUCTIVITYMagne
- Page 110 and 111:
2009 APPLIED SUPERCONDUCTIVITYPhtha
- Page 112:
2009Magneto-Science105
- Page 115 and 116:
MAGNETO-SCIENCE 2009Study of the in
- Page 117 and 118:
MAGNETO-SCIENCE 2009Magnetohydrodyn
- Page 119 and 120:
MAGNETO-SCIENCE 2009112
- Page 122 and 123:
2009 MAGNET DEVELOPMENT AND INSTRUM
- Page 124 and 125:
2009 MAGNET DEVELOPMENT AND INSTRUM
- Page 126 and 127:
2009 MAGNET DEVELOPMENT AND INSTRUM
- Page 128 and 129:
2009 MAGNET DEVELOPMENT AND INSTRUM
- Page 130 and 131:
2009 MAGNET DEVELOPMENT AND INSTRUM
- Page 132 and 133:
2009 MAGNET DEVELOPMENT AND INSTRUM
- Page 134 and 135:
2009 MAGNET DEVELOPMENT AND INSTRUM
- Page 136 and 137:
2009 PROPOSALSProposals for Magnet
- Page 138 and 139:
2009 PROPOSALSSpin-Jahn-Teller effe
- Page 140 and 141:
2009 PROPOSALSQuantum Oscillations
- Page 142 and 143:
2009 PROPOSALSThermoelectric tensor
- Page 144 and 145:
2009 PROPOSALSDr. EscoffierCyclotro
- Page 146 and 147:
2009 PROPOSALSHigh field magnetotra
- Page 148 and 149:
2009 THESESPhD Theses 20091. Nanot
- Page 150 and 151:
2009 PUBLICATIONS[21] O. Drachenko,
- Page 152 and 153:
2009 PUBLICATIONS[75] S. Nowak, T.
- Page 154 and 155:
Contributors of the LNCMI to the Pr
- Page 156 and 157:
Institut Jean Lamour, Nancy : 68Ins
- Page 158 and 159:
Lawrence Berkeley National Laborato