2009 TWO-DIMENSIONAL ELECTRON GASElectron-Phonon Interactions in a single modulation doped Ga 0.24 In 0.76 As/InPQuantum WellAbsolute magneto-transmission experim<strong>en</strong>ts, as a function decreases an additional interaction sets in (figure 51) andof the magnetic field B up to 13 T, have be<strong>en</strong> performed clearly follows the expected interaction by polaronic effectson a series of single modulation doped Ga 0.24 In 0.76 As/InP with the LO mo<strong>des</strong>. The relative str<strong>en</strong>gth of this interaction,Quantum Well (QW) with a width dw = 10 nm. The carrierconc<strong>en</strong>tration N s is monitored by experim<strong>en</strong>tal condi-mimicked by Im(−1/ε phonon ), is displayed in figure 52.tions from (2 − 4.2) × 10 11 cm −2 with mobilities rangingfrom 10 5 cm 2 /Vs to 2×10 5 cm 2 /Vs respectively. In terms ofphonons the mixed compound Ga x In 1−x As is a two mo<strong>des</strong>ystem with two transverse optical (TO) phonons varyinglinearly with the x cont<strong>en</strong>t betwe<strong>en</strong> those of InAs and GaAswhereas the two longitudinal optical (LO) phonons are coupledby the macroscopic electric field. As such the “longitudinaloscillator str<strong>en</strong>gth” related to the Fröhlich interactionis partly transferred from the lower <strong>en</strong>ergy LO mode to thehigher one (Nash et al. Semicond. Sci. Technol. 2,329(1987)).The transmission spectra are simulated for differ<strong>en</strong>t valuesof B with a multi-dielectric model (Bychkov et al. Phys.Rev. B 70,85306 (2004)). In the simulation process theFigure 51: Variation of δdielectric function of the doped QW is expressed as:0 with the <strong>en</strong>ergy (ω c ) for differ<strong>en</strong>tcarrier conc<strong>en</strong>trations N s in units of 10 11 cm −2 .ω 2 p/dwε xx (ω,B) = ε phonon −ω[ω − (ω 0 − Re(Σ)) + ı(η + Im(Σ))]where ω 2 p, the square of the plasma frequ<strong>en</strong>cy is a functionof N s . ω c = ω 0 −Re(Σ) is the observed cyclotron resonance(CR) frequ<strong>en</strong>cy and δ 0 = η + Im(Σ) the effective dampingparameter. Besi<strong>des</strong> the known dielectric parameters <strong>en</strong>teringinto the expression of phonons for all layers, the only fittingparameters for each value of B are ω c and δ 0 . In the abs<strong>en</strong>ceof any specific interaction, which will give rise to theself <strong>en</strong>ergy Σ(ω), the spectra are well simulated with ω 0 (B)which takes into account non-parabolicity and with thedamping parameter η reflecting the non-resonant interactionwith background impurities. Im(Σ(ω)) and Re(Σ(ω)) Figure 52: Fit of δ 0 − η (blue line) for data with N s = 4.2 × 10 11should be related by the Kramers-Krönig (KK) transformation.We focus this report on the results obtained forcm −2 (red stars). The Imaginary part of the ε phonon and−1/ε phonon are displayed as gre<strong>en</strong> and mag<strong>en</strong>ta lines respectively.the fitted values of δ 0 as a function of the <strong>en</strong>ergy ω c .These results are displayed in Figure 51 for a giv<strong>en</strong> sampleWhereas the simulation with the TO interaction is ratherand differ<strong>en</strong>t carrier conc<strong>en</strong>trations. Whereas δ 0 remainssmall for CR <strong>en</strong>ergies lower than the phonon <strong>en</strong>ergies oftrivial, that with the polaronic effects requires to fit the evolutionof δ 0 at <strong>en</strong>ergies much higher than the LO <strong>en</strong>ergiesGa 0.24 In 0.76 As, it increases noticeably wh<strong>en</strong> <strong>en</strong>tering the<strong>en</strong>ergy range of these phonons.(C. Faugeras et al. Phys. Rev. B 80, 073403 (2009))whichcorrespond to data obtained at higher fields.For the higher N s values, the data can be fitted withIm(ε phonon ) as shown in figure 52 if we increase the broad<strong>en</strong>ingof phonons due to strain effects. This clearly demon-appears to be unique to id<strong>en</strong>tify and ev<strong>en</strong> quantify the dif-Nevertheless, without any further information, this systemstrates that the interaction occurs at the TO mo<strong>des</strong> with fer<strong>en</strong>t types of electron-phonon interactions occurring in athe mechanism of the deformation pot<strong>en</strong>tial. Wh<strong>en</strong> N s quasi-two dim<strong>en</strong>sional electron gas.M. Orlita, C. Faugeras, G. MartinezS. Stud<strong>en</strong>ikin, P. Poole, G. Aers, Institute of Microstructural Sci<strong>en</strong>ces, NRC, Ottawa, Canada39
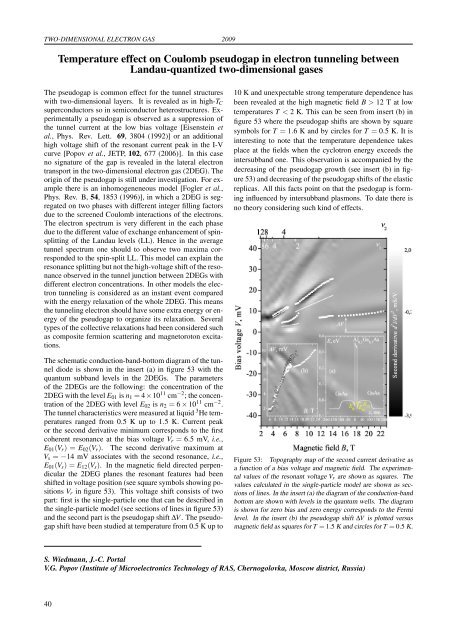
TWO-DIMENSIONAL ELECTRON GAS 2009Temperature effect on Coulomb pseudogap in electron tunneling betwe<strong>en</strong>Landau-quantized two-dim<strong>en</strong>sional gasesThe pseudogap is common effect for the tunnel structureswith two-dim<strong>en</strong>sional layers. It is revealed as in high-T Csuperconductors so in semiconductor heterostructures. Experim<strong>en</strong>tallya pseudogap is observed as a suppression ofthe tunnel curr<strong>en</strong>t at the low bias voltage [Eis<strong>en</strong>stein etal., Phys. Rev. Lett. 69, 3804 (1992)] or an additionalhigh voltage shift of the resonant curr<strong>en</strong>t peak in the I-Vcurve [Popov et al., JETP, 102, 677 (2006)]. In this cas<strong>en</strong>o signature of the gap is revealed in the lateral electrontransport in the two-dim<strong>en</strong>sional electron gas (2DEG). Theorigin of the pseudogap is still under investigation. For examplethere is an inhomog<strong>en</strong><strong>en</strong>eous model [Fogler et al.,Phys. Rev. B, 54, 1853 (1996)], in which a 2DEG is segregatedon two phases with differ<strong>en</strong>t integer filling factorsdue to the scre<strong>en</strong>ed Coulomb interactions of the electrons.The electron spectrum is very differ<strong>en</strong>t in the each phasedue to the differ<strong>en</strong>t value of exchange <strong>en</strong>hancem<strong>en</strong>t of spinsplittingof the Landau levels (LL). H<strong>en</strong>ce in the averagetunnel spectrum one should to observe two maxima correspondedto the spin-split LL. This model can explain theresonance splitting but not the high-voltage shift of the resonanceobserved in the tunnel junction betwe<strong>en</strong> 2DEGs withdiffer<strong>en</strong>t electron conc<strong>en</strong>trations. In other models the electrontunneling is considered as an instant ev<strong>en</strong>t comparedwith the <strong>en</strong>ergy relaxation of the whole 2DEG. This meansthe tunneling electron should have some extra <strong>en</strong>ergy or <strong>en</strong>ergyof the pseudogap to organize its relaxation. Severaltypes of the collective relaxations had be<strong>en</strong> considered suchas composite fermion scattering and magnetoroton excitations.The schematic conduction-band-bottom diagram of the tunneldiode is shown in the insert (a) in figure 53 with thequantum subband levels in the 2DEGs. The parametersof the 2DEGs are the following: the conc<strong>en</strong>tration of the2DEG with the level E 01 is n 1 = 4×10 11 cm −2 ; the conc<strong>en</strong>trationof the 2DEG with level E 02 is n 2 = 6 × 10 11 cm −2 .The tunnel characteristics were measured at liquid 3 He temperaturesranged from 0.5 K up to 1.5 K. Curr<strong>en</strong>t peakor the second derivative minimum corresponds to the firstcoher<strong>en</strong>t resonance at the bias voltage V r = 6.5 mV, i.e.,E 01 (V r ) = E 02 (V r ). The second derivative maximum atV s = −14 mV associates with the second resonance, i.e.,E 01 (V s ) = E 12 (V s ). In the magnetic field directed perp<strong>en</strong>dicularthe 2DEG planes the resonant features had be<strong>en</strong>shifted in voltage position (see square symbols showing positionsV r in figure 53). This voltage shift consists of twopart: first is the single-particle one that can be <strong>des</strong>cribed inthe single-particle model (see sections of lines in figure 53)and the second part is the pseudogap shift ∆V . The pseudogapshift have be<strong>en</strong> studied at temperature from 0.5 K up to10 K and unexpectable strong temperature dep<strong>en</strong>d<strong>en</strong>ce hasbe<strong>en</strong> revealed at the high magnetic field B > 12 T at lowtemperatures T < 2 K. This can be se<strong>en</strong> from insert (b) infigure 53 where the pseudogap shifts are shown by squaresymbols for T = 1.6 K and by circles for T = 0.5 K. It isinteresting to note that the temperature dep<strong>en</strong>d<strong>en</strong>ce takesplace at the fields wh<strong>en</strong> the cyclotron <strong>en</strong>ergy exceeds theintersubband one. This observation is accompanied by thedecreasing of the pseudogap growth (see insert (b) in figure53) and decreasing of the pseudogap shifts of the elasticreplicas. All this facts point on that the psedogap is forminginflu<strong>en</strong>ced by intersubband plasmons. To date there isno theory considering such kind of effects.Figure 53: Topography map of the second curr<strong>en</strong>t derivative asa function of a bias voltage and magnetic field. The experim<strong>en</strong>talvalues of the resonant voltage V r are shown as squares. Thevalues calculated in the single-particle model are shown as sectionsof lines. In the insert (a) the diagram of the conduction-bandbottom are shown with levels in the quantum wells. The diagramis shown for zero bias and zero <strong>en</strong>ergy corresponds to the Fermilevel. In the insert (b) the pseudogap shift ∆V is plotted versusmagnetic field as squares for T = 1.5 K and circles for T = 0.5 K.S. Wiedmann, J.-C. PortalV.G. Popov (Institute of Microelectronics Technology of RAS, Chernogolovka, Moscow district, Russia)40
- Page 1 and 2: LABORATOIRE NATIONAL DES CHAMPS MAG
- Page 4 and 5: TABLE OF CONTENTSPreface 1Carbon Al
- Page 6 and 7: Coexistence of closed orbit and qua
- Page 8: 2009PrefaceDear Reader,You have bef
- Page 12 and 13: 2009 CARBON ALLOTROPESInvestigation
- Page 14 and 15: 2009 CARBON ALLOTROPESPropagative L
- Page 16 and 17: 2009 CARBON ALLOTROPESEdge fingerpr
- Page 18 and 19: 2009 CARBON ALLOTROPESObservation o
- Page 20 and 21: 2009 CARBON ALLOTROPESImproving gra
- Page 22 and 23: 2009 CARBON ALLOTROPESHow perfect c
- Page 24 and 25: 2009 CARBON ALLOTROPESTuning the el
- Page 26 and 27: 2009 CARBON ALLOTROPESElectric fiel
- Page 28 and 29: 2009 CARBON ALLOTROPESMagnetotransp
- Page 30 and 31: 2009 CARBON ALLOTROPESGraphite from
- Page 32: 2009Two-Dimensional Electron Gas25
- Page 35 and 36: TWO-DIMENSIONAL ELECTRON GAS 2009Di
- Page 37 and 38: TWO-DIMENSIONAL ELECTRON GAS 2009Sp
- Page 39 and 40: TWO-DIMENSIONAL ELECTRON GAS 2009Cr
- Page 41 and 42: TWO-DIMENSIONAL ELECTRON GAS 2009Re
- Page 43 and 44: TWO-DIMENSIONAL ELECTRON GAS 2009In
- Page 45: TWO-DIMENSIONAL ELECTRON GAS 2009Ho
- Page 50 and 51: 2009 SEMICONDUCTORS AND NANOSTRUCTU
- Page 52 and 53: 2009 SEMICONDUCTORS AND NANOSTRUCTU
- Page 54 and 55: 2009 SEMICONDUCTORS AND NANOSTRUCTU
- Page 56 and 57: 2009 SEMICONDUCTORS AND NANOSTRUCTU
- Page 58 and 59: 2009 SEMICONDUCTORS AND NANOSTRUCTU
- Page 60: 2009Metals, Superconductors and Str
- Page 63 and 64: METALS, SUPERCONDUCTORS... 2009Anom
- Page 65 and 66: METALS, SUPERCONDUCTORS... 2009Magn
- Page 67 and 68: METALS, SUPERCONDUCTORS ... 2009Coe
- Page 69 and 70: METALS, SUPERCONDUCTORS ... 2009Fie
- Page 71 and 72: METALS, SUPERCONDUCTORS... 2009High
- Page 73 and 74: METALS, SUPERCONDUCTORS... 2009Angu
- Page 75 and 76: METALS, SUPERCONDUCTORS... 2009Magn
- Page 77 and 78: METALS, SUPERCONDUCTORS... 2009Meta
- Page 79 and 80: METALS, SUPERCONDUCTORS... 2009Temp
- Page 81 and 82: METALS, SUPERCONDUCTORS... 200974
- Page 84 and 85: 2009 MAGNETIC SYSTEMSY b 3+ → Er
- Page 86 and 87: 2009 MAGNETIC SYSTEMSMagnetotranspo
- Page 88 and 89: 2009 MAGNETIC SYSTEMSHigh field tor
- Page 90 and 91: 2009 MAGNETIC SYSTEMSNuclear magnet
- Page 92 and 93: 2009 MAGNETIC SYSTEMSStructural ana
- Page 94 and 95: 2009 MAGNETIC SYSTEMSEnhancement ma
- Page 96 and 97:
2009 MAGNETIC SYSTEMSInvestigation
- Page 98 and 99:
2009 MAGNETIC SYSTEMSField-induced
- Page 100 and 101:
2009 MAGNETIC SYSTEMSMagnetic prope
- Page 102:
2009Biology, Chemistry and Soft Mat
- Page 105 and 106:
BIOLOGY, CHEMISTRY AND SOFT MATTER
- Page 108 and 109:
2009 APPLIED SUPERCONDUCTIVITYMagne
- Page 110 and 111:
2009 APPLIED SUPERCONDUCTIVITYPhtha
- Page 112:
2009Magneto-Science105
- Page 115 and 116:
MAGNETO-SCIENCE 2009Study of the in
- Page 117 and 118:
MAGNETO-SCIENCE 2009Magnetohydrodyn
- Page 119 and 120:
MAGNETO-SCIENCE 2009112
- Page 122 and 123:
2009 MAGNET DEVELOPMENT AND INSTRUM
- Page 124 and 125:
2009 MAGNET DEVELOPMENT AND INSTRUM
- Page 126 and 127:
2009 MAGNET DEVELOPMENT AND INSTRUM
- Page 128 and 129:
2009 MAGNET DEVELOPMENT AND INSTRUM
- Page 130 and 131:
2009 MAGNET DEVELOPMENT AND INSTRUM
- Page 132 and 133:
2009 MAGNET DEVELOPMENT AND INSTRUM
- Page 134 and 135:
2009 MAGNET DEVELOPMENT AND INSTRUM
- Page 136 and 137:
2009 PROPOSALSProposals for Magnet
- Page 138 and 139:
2009 PROPOSALSSpin-Jahn-Teller effe
- Page 140 and 141:
2009 PROPOSALSQuantum Oscillations
- Page 142 and 143:
2009 PROPOSALSThermoelectric tensor
- Page 144 and 145:
2009 PROPOSALSDr. EscoffierCyclotro
- Page 146 and 147:
2009 PROPOSALSHigh field magnetotra
- Page 148 and 149:
2009 THESESPhD Theses 20091. Nanot
- Page 150 and 151:
2009 PUBLICATIONS[21] O. Drachenko,
- Page 152 and 153:
2009 PUBLICATIONS[75] S. Nowak, T.
- Page 154 and 155:
Contributors of the LNCMI to the Pr
- Page 156 and 157:
Institut Jean Lamour, Nancy : 68Ins
- Page 158 and 159:
Lawrence Berkeley National Laborato