2009 METALS, SUPERCONDUCTORS...Fermi surface study in the hidd<strong>en</strong> order state of URu 2 Si 2The heavy fermion superconductor URu 2 Si 2 has attractedmuch att<strong>en</strong>tion for the past two deca<strong>des</strong> because of the socalledhidd<strong>en</strong> order (HO) phase below T 0 = 17.5K, wherea tiny magnetic mom<strong>en</strong>t of 0.03µ B with the wave vectorQ 0 = (1,0,0) appears. The associated <strong>en</strong>tropy at T 0 is,however, too large. That is why many theoretical modelshave be<strong>en</strong> proposed, such as, spin- and/or charge-d<strong>en</strong>sitywave, higher orbital ordering, helicity order, etc. Furthermoreit was rec<strong>en</strong>tly reported that a new phase transition ora crossover appears at H ∗ = 23T below 2K [Shishido et al.Phys. Rev. Lett. 102, 156403 (2009)]. Above H ∗ , a newdHvA frequ<strong>en</strong>cy with relatively light effective mass was detectedin a high quality sample. Nevertheless, there are stillundetected Fermi surfaces, considering the large specificheat coeffici<strong>en</strong>ts and carrier numbers. It is important to determinethe electronic states from the microscopic point ofviews. One of the most powerful experim<strong>en</strong>tal probe is thede Haas-van Alph<strong>en</strong> (dHvA) or Shubnikov-de Haas (SdH)effects. Rec<strong>en</strong>tly, we succeeded in growing high qualityURu 2 Si 2 single crystals (RRR > 200) in order to performthe SdH experim<strong>en</strong>ts. Here we report the rec<strong>en</strong>t results ofSdH experim<strong>en</strong>ts using high quality single crystals at highfields up to 34T and at low temperatures down to 30mK.Figure 84(a) shows the magnetoresistance for the curr<strong>en</strong>talong [100] at various field directions in URu 2 Si 2 . Thelarge magnetoresistance and clear SdH oscillation indicatethe high quality of our sample. The kink is clearly detectedfor H ‖ [001] at H ∗ = 24T, which shifts to the higher fieldwith increasing the field angle from [001] to [100]. Theangular dep<strong>en</strong>d<strong>en</strong>ce of H ∗ is shown in Fig. 84(b). H ∗ approximatelyfollows the 1/cosθ-dep<strong>en</strong>d<strong>en</strong>ce. We show infigure 85 the typical SdH oscillation for H ‖ [001] and forthe field tilted 52deg from [001] to [100]. As clearly se<strong>en</strong>in figure 85, the SdH amplitude abruptly increases aboveH ∗ for H ‖ [001], while the SdH amplitude at field angle52deg smoothly increases, following the Lifshitz-Kosevichformula. Below H ∗ , the fast Fourier transform (FFT) analysisshows three kinds of SdH branches, namely α, β andγ. The cyclotron effective masses for H ‖ [001] below H ∗are 12m 0 and 18m 0 for branch α and β, respectively. Althoughthe number of wave is not <strong>en</strong>ough to analyze thedata, the SdH frequ<strong>en</strong>cy for branches α and β shows nochange above H ∗ , however, the cyclotron mass for branchβ seems to decrease above H ∗ . These results clearly indicatethat the electronic state is changed above H ∗ in the HOstate. Further experim<strong>en</strong>ts, such as thermoelectric power,are required to confirm this point.Figure 84: (a)Magnetoresistance at various field directions from[001] to [100] at 30mK in URu 2 Si 2 . (b)Angular dep<strong>en</strong>d<strong>en</strong>ce ofH ∗ , which is defined as a kink of magnetoresistance. The solidline corresponds to the 1/cosθ dep<strong>en</strong>d<strong>en</strong>ce.Figure 85: Typical Shubnikov-de Haas oscillations for the fieldalong [001] and for the field tilted 52deg from [001] to [100].I. SheikinD. Aoki, E. Hassinger, V. Taufour, J. Flouquet (CEA-Gr<strong>en</strong>oble),63
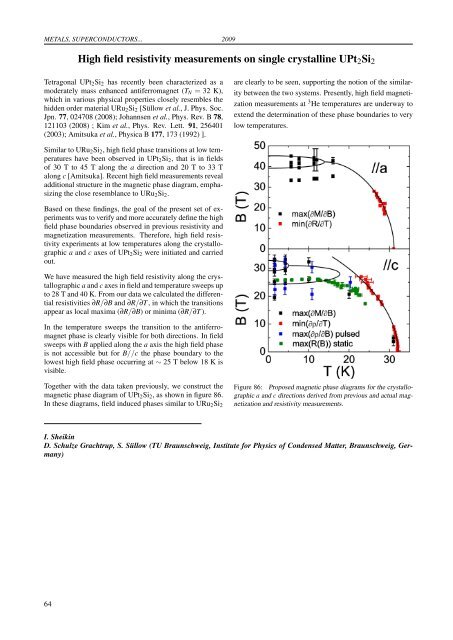
METALS, SUPERCONDUCTORS... 2009High field resistivity measurem<strong>en</strong>ts on single crystalline UPt 2 Si 2Tetragonal UPt 2 Si 2 has rec<strong>en</strong>tly be<strong>en</strong> characterized as amoderately mass <strong>en</strong>hanced antiferromagnet (T N = 32 K),which in various physical properties closely resembles thehidd<strong>en</strong> order material URu 2 Si 2 [Süllow et al., J. Phys. Soc.Jpn. 77, 024708 (2008); Johanns<strong>en</strong> et al., Phys. Rev. B 78,121103 (2008) ; Kim et al., Phys. Rev. Lett. 91, 256401(2003); Amitsuka et al., Physica B 177, 173 (1992) ].are clearly to be se<strong>en</strong>, supporting the notion of the similaritybetwe<strong>en</strong> the two systems. Pres<strong>en</strong>tly, high field magnetizationmeasurem<strong>en</strong>ts at 3 He temperatures are underway toext<strong>en</strong>d the determination of these phase boundaries to verylow temperatures.Similar to URu 2 Si 2 , high field phase transitions at low temperatureshave be<strong>en</strong> observed in UPt 2 Si 2 , that is in fieldsof 30 T to 45 T along the a direction and 20 T to 33 Talong c [Amitsuka]. Rec<strong>en</strong>t high field measurem<strong>en</strong>ts revealadditional structure in the magnetic phase diagram, emphasizingthe close resemblance to URu 2 Si 2 .Based on these findings, the goal of the pres<strong>en</strong>t set of experim<strong>en</strong>tswas to verify and more accurately define the highfield phase boundaries observed in previous resistivity andmagnetization measurem<strong>en</strong>ts. Therefore, high field resistivityexperim<strong>en</strong>ts at low temperatures along the crystallographica and c axes of UPt 2 Si 2 were initiated and carriedout.We have measured the high field resistivity along the crystallographica and c axes in field and temperature sweeps upto 28 T and 40 K. From our data we calculated the differ<strong>en</strong>tialresistivities ∂R/∂B and ∂R/∂T , in which the transitionsappear as local maxima (∂R/∂B) or minima (∂R/∂T ).In the temperature sweeps the transition to the antiferromagnetphase is clearly visible for both directions. In fieldsweeps with B applied along the a axis the high field phaseis not accessible but for B//c the phase boundary to thelowest high field phase occurring at ∼ 25 T below 18 K isvisible.Together with the data tak<strong>en</strong> previously, we construct themagnetic phase diagram of UPt 2 Si 2 , as shown in figure 86.In these diagrams, field induced phases similar to URu 2 Si 2Figure 86: Proposed magnetic phase diagrams for the crystallographica and c directions derived from previous and actual magnetizationand resistivity measurem<strong>en</strong>ts.I. SheikinD. Schulze Grachtrup, S. Süllow (TU Braunschweig, Institute for Physics of Cond<strong>en</strong>sed Matter, Braunschweig, Germany)64
- Page 1 and 2:
LABORATOIRE NATIONAL DES CHAMPS MAG
- Page 4 and 5:
TABLE OF CONTENTSPreface 1Carbon Al
- Page 6 and 7:
Coexistence of closed orbit and qua
- Page 8:
2009PrefaceDear Reader,You have bef
- Page 12 and 13:
2009 CARBON ALLOTROPESInvestigation
- Page 14 and 15:
2009 CARBON ALLOTROPESPropagative L
- Page 16 and 17:
2009 CARBON ALLOTROPESEdge fingerpr
- Page 18 and 19:
2009 CARBON ALLOTROPESObservation o
- Page 20 and 21: 2009 CARBON ALLOTROPESImproving gra
- Page 22 and 23: 2009 CARBON ALLOTROPESHow perfect c
- Page 24 and 25: 2009 CARBON ALLOTROPESTuning the el
- Page 26 and 27: 2009 CARBON ALLOTROPESElectric fiel
- Page 28 and 29: 2009 CARBON ALLOTROPESMagnetotransp
- Page 30 and 31: 2009 CARBON ALLOTROPESGraphite from
- Page 32: 2009Two-Dimensional Electron Gas25
- Page 35 and 36: TWO-DIMENSIONAL ELECTRON GAS 2009Di
- Page 37 and 38: TWO-DIMENSIONAL ELECTRON GAS 2009Sp
- Page 39 and 40: TWO-DIMENSIONAL ELECTRON GAS 2009Cr
- Page 41 and 42: TWO-DIMENSIONAL ELECTRON GAS 2009Re
- Page 43 and 44: TWO-DIMENSIONAL ELECTRON GAS 2009In
- Page 45 and 46: TWO-DIMENSIONAL ELECTRON GAS 2009Ho
- Page 47 and 48: TWO-DIMENSIONAL ELECTRON GAS 2009Te
- Page 50 and 51: 2009 SEMICONDUCTORS AND NANOSTRUCTU
- Page 52 and 53: 2009 SEMICONDUCTORS AND NANOSTRUCTU
- Page 54 and 55: 2009 SEMICONDUCTORS AND NANOSTRUCTU
- Page 56 and 57: 2009 SEMICONDUCTORS AND NANOSTRUCTU
- Page 58 and 59: 2009 SEMICONDUCTORS AND NANOSTRUCTU
- Page 60: 2009Metals, Superconductors and Str
- Page 63 and 64: METALS, SUPERCONDUCTORS... 2009Anom
- Page 65 and 66: METALS, SUPERCONDUCTORS... 2009Magn
- Page 67 and 68: METALS, SUPERCONDUCTORS ... 2009Coe
- Page 69: METALS, SUPERCONDUCTORS ... 2009Fie
- Page 73 and 74: METALS, SUPERCONDUCTORS... 2009Angu
- Page 75 and 76: METALS, SUPERCONDUCTORS... 2009Magn
- Page 77 and 78: METALS, SUPERCONDUCTORS... 2009Meta
- Page 79 and 80: METALS, SUPERCONDUCTORS... 2009Temp
- Page 81 and 82: METALS, SUPERCONDUCTORS... 200974
- Page 84 and 85: 2009 MAGNETIC SYSTEMSY b 3+ → Er
- Page 86 and 87: 2009 MAGNETIC SYSTEMSMagnetotranspo
- Page 88 and 89: 2009 MAGNETIC SYSTEMSHigh field tor
- Page 90 and 91: 2009 MAGNETIC SYSTEMSNuclear magnet
- Page 92 and 93: 2009 MAGNETIC SYSTEMSStructural ana
- Page 94 and 95: 2009 MAGNETIC SYSTEMSEnhancement ma
- Page 96 and 97: 2009 MAGNETIC SYSTEMSInvestigation
- Page 98 and 99: 2009 MAGNETIC SYSTEMSField-induced
- Page 100 and 101: 2009 MAGNETIC SYSTEMSMagnetic prope
- Page 102: 2009Biology, Chemistry and Soft Mat
- Page 105 and 106: BIOLOGY, CHEMISTRY AND SOFT MATTER
- Page 108 and 109: 2009 APPLIED SUPERCONDUCTIVITYMagne
- Page 110 and 111: 2009 APPLIED SUPERCONDUCTIVITYPhtha
- Page 112: 2009Magneto-Science105
- Page 115 and 116: MAGNETO-SCIENCE 2009Study of the in
- Page 117 and 118: MAGNETO-SCIENCE 2009Magnetohydrodyn
- Page 119 and 120: MAGNETO-SCIENCE 2009112
- Page 122 and 123:
2009 MAGNET DEVELOPMENT AND INSTRUM
- Page 124 and 125:
2009 MAGNET DEVELOPMENT AND INSTRUM
- Page 126 and 127:
2009 MAGNET DEVELOPMENT AND INSTRUM
- Page 128 and 129:
2009 MAGNET DEVELOPMENT AND INSTRUM
- Page 130 and 131:
2009 MAGNET DEVELOPMENT AND INSTRUM
- Page 132 and 133:
2009 MAGNET DEVELOPMENT AND INSTRUM
- Page 134 and 135:
2009 MAGNET DEVELOPMENT AND INSTRUM
- Page 136 and 137:
2009 PROPOSALSProposals for Magnet
- Page 138 and 139:
2009 PROPOSALSSpin-Jahn-Teller effe
- Page 140 and 141:
2009 PROPOSALSQuantum Oscillations
- Page 142 and 143:
2009 PROPOSALSThermoelectric tensor
- Page 144 and 145:
2009 PROPOSALSDr. EscoffierCyclotro
- Page 146 and 147:
2009 PROPOSALSHigh field magnetotra
- Page 148 and 149:
2009 THESESPhD Theses 20091. Nanot
- Page 150 and 151:
2009 PUBLICATIONS[21] O. Drachenko,
- Page 152 and 153:
2009 PUBLICATIONS[75] S. Nowak, T.
- Page 154 and 155:
Contributors of the LNCMI to the Pr
- Page 156 and 157:
Institut Jean Lamour, Nancy : 68Ins
- Page 158 and 159:
Lawrence Berkeley National Laborato