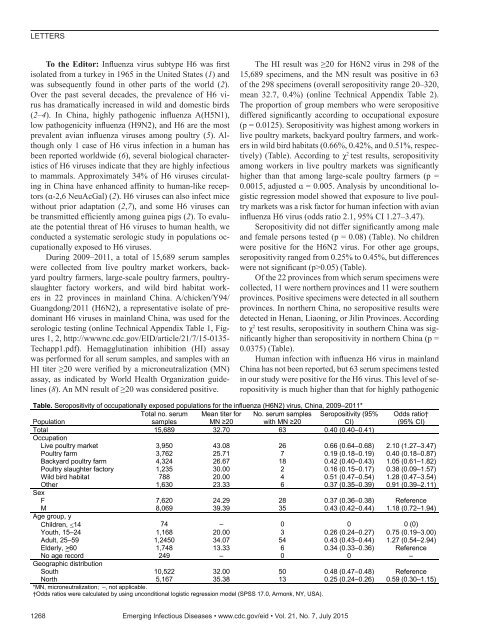
LETTERSTo the Editor: Influenza virus subtype H6 was firstisolated from a turkey in 1965 in the United States (1) andwas subsequently found in other parts of the world (2).Over the past several decades, the prevalence of H6 virushas dramatically increased in wild and domestic birds(2–4). In China, highly pathogenic influenza A(H5N1),low pathogenicity influenza (H9N2), and H6 are the mostprevalent avian influenza viruses among poultry (5). Althoughonly 1 case of H6 virus infection in a human hasbeen reported worldwide (6), several biological characteristicsof H6 viruses indicate that they are highly infectiousto mammals. Approximately 34% of H6 viruses circulatingin China have enhanced affinity to human-like receptors(ɑ-2,6 NeuAcGal) (2). H6 viruses can also infect micewithout prior adaptation (2,7), and some H6 viruses canbe transmitted efficiently among guinea pigs (2). To evaluatethe potential threat of H6 viruses to human health, weconducted a systematic serologic study in populations occupationallyexposed to H6 viruses.During 2009–2011, a total of 15,689 serum sampleswere collected from live poultry market workers, backyardpoultry farmers, large-scale poultry farmers, poultryslaughterfactory workers, and wild bird habitat workersin 22 provinces in mainland China. A/chicken/Y94/Guangdong/2011 (H6N2), a representative isolate of predominantH6 viruses in mainland China, was used for theserologic testing (online Technical Appendix Table 1, Figures1, 2, http://wwwnc.cdc.gov/EID/article/21/7/15-0135-Techapp1.<strong>pdf</strong>). Hemagglutination inhibition (HI) assaywas performed for all serum samples, and samples with anHI titer ≥20 were verified by a microneutralization (MN)assay, as indicated by World Health Organization guidelines(8). An MN result of ≥20 was considered positive.The HI result was ≥20 for H6N2 virus in 298 of the15,689 specimens, and the MN result was positive in 63of the 298 specimens (overall seropositivity range 20–320,mean 32.7, 0.4%) (online Technical Appendix Table 2).The proportion of group members who were seropositivediffered significantly according to occupational exposure(p = 0.0125). Seropositivity was highest among workers inlive poultry markets, backyard poultry farmers, and workersin wild bird habitats (0.66%, 0.42%, and 0.51%, respectively)(Table). According to χ 2 test results, seropositivityamong workers in live poultry markets was significantlyhigher than that among large-scale poultry farmers (p =0.0015, adjusted ɑ = 0.005. Analysis by unconditional logisticregression model showed that exposure to live poultrymarkets was a risk factor for human infection with avianinfluenza H6 virus (odds ratio 2.1, 95% CI 1.27–3.47).Seropositivity did not differ significantly among maleand female persons tested (p = 0.08) (Table). No childrenwere positive for the H6N2 virus. For other age groups,seropositivity ranged from 0.25% to 0.45%, but differenceswere not significant (p>0.05) (Table).Of the 22 provinces from which serum specimens werecollected, 11 were northern provinces and 11 were southernprovinces. Positive specimens were detected in all southernprovinces. In northern China, no seropositive results weredetected in Henan, Liaoning, or Jilin Provinces. Accordingto χ 2 test results, seropositivity in southern China was significantlyhigher than seropositivity in northern China (p =0.0375) (Table).Human infection with influenza H6 virus in mainlandChina has not been reported, but 63 serum specimens testedin our study were positive for the H6 virus. This level of seropositivityis much higher than that for highly pathogenicTable. Seropositivity of occupationally exposed populations for the influenza (H6N2) virus, China, 2009–2011*PopulationTotal no. serumsamplesMean titer forMN ≥20No. serum sampleswith MN ≥20Seropositivity (95%CI)Odds ratio†(95% CI)Total 15,689 32.70 63 0.40 (0.40–0.41)OccupationLive poultry market 3,950 43.08 26 0.66 (0.64–0.68) 2.10 (1.27–3.47)Poultry farm 3,762 25.71 7 0.19 (0.18–0.19) 0.40 (0.18–0.87)Backyard poultry farm 4,324 26.67 18 0.42 (0.40–0.43) 1.05 (0.61–1.82)Poultry slaughter factory 1,235 30.00 2 0.16 (0.15–0.17) 0.38 (0.09–1.57)Wild bird habitat 788 20.00 4 0.51 (0.47–0.54) 1.28 (0.47–3.54)Other 1,630 23.33 6 0.37 (0.35–0.39) 0.91 (0.39–2.11)SexF 7,620 24.29 28 0.37 (0.36–0.38) ReferenceM 8,069 39.39 35 0.43 (0.42–0.44) 1.18 (0.72–1.94)Age group, yChildren, 14 74 – 0 0 0 (0)Youth, 15–24 1,168 20.00 3 0.26 (0.24–0.27) 0.75 (0.19–3.00)Adult, 25–59 1,2450 34.07 54 0.43 (0.43–0.44) 1.27 (0.54–2.94)Elderly, >60 1,748 13.33 6 0.34 (0.33–0.36) ReferenceNo age record 249 – 0 0 –Geographic distributionSouth 10,522 32.00 50 0.48 (0.47–0.48) ReferenceNorth 5,167 35.38 13 0.25 (0.24–0.26) 0.59 (0.30–1.15)*MN, microneutralization; –, not applicable.†Odds ratios were calculated by using unconditional logistic regression model (SPSS 17.0, Armonk, NY, USA).1268 Emerging Infectious Diseases • www.cdc.gov/eid • Vol. 21, No. 7, July 2015
LETTERSavian influenza A(H5N1) virus, for which only 2 of the serumspecimens we tested were positive (data not shown),but much lower than the seropositivity level for lowpathogenicity avian influenza A(H9N2) virus; 3.4% of thesamples tested were positive for A/Chicken/Hong Kong/G9/1997(H9N2)–like virus (data not shown). A previousUS study has reported H6N2-positive antibodies in veterinarians(9). Our results and the veterinarian study indicatethat the H6N2 virus could infect humans.In our study, positive samples were detected in 19 of22 provinces and in all tested worker populations, suggestingthat the H6 virus has been broadly circulating in birdsin China. Live poultry market exposure is the major riskfactor for human infection with avian influenza H6 virus.The limitation of this study is that antigen selection maynot accurately detect neutralization antibodies for differentsubtypes of H6 viruses. Surveillance of the H6 virusin birds and occupationally exposed populations should bestrengthened for pandemic preparedness.7. Gillim-Ross L, Santos C, Chen Z, Aspelund A, Yang CF, Ye D,et al. Avian influenza H6 viruses productively infect and causeillness in mice and ferrets. J Virol. 2008;82:10854–63.http://dx.doi.org/10.1128/JVI.01206-088. World Health Organization. Manual for the laboratory diagnosis andvirological surveillance of influenza. Geneva: The Organization;2011. p. 63–77.9. Myers KP, Setterquist SF, Capuano AW, Gray GC. Infection dueto 3 avian influenza subtypes in United States veterinarians. ClinInfect Dis. 2007;45:4–9. http://dx.doi.org/10.1086/518579Address for correspondence: Yue Long SHU, National Institute for ViralDisease Control and Prevention, Chinese Center for Disease Control andPrevention, Key Laboratory for Medical Virology, Ministry of Health,Beijing, 102206, China; email: yshu@cnic.org.cnAbsence of MERS-Coronavirusin Bactrian Camels, SouthernMongolia, November 2014AcknowledgmentsThis study was performed under the serology surveillance systemof occupationally exposed populations in China. We are deeplythankful for the contributions of all National Influenza SurveillanceNetwork members, including the China Centers for DiseaseControl and Prevention in the provinces and in the prefects, all ofwhich collected samples for years. We also thank Ms. Qiao-hongLiao for providing consultation on statistical analysis.This study was supported in part by the China–United Statescooperation project “Developing sustainable influenza surveillancenetworks and response to avian and pandemic influenza inChina” and by the China National Mega-projects for InfectiousDiseases (2014ZX10004002).References1. Downie JC, Webster RG, Schild GC, Dowdle WR, Laver WG.Characterization and ecology of a type A influenza virus isolatedfrom a shearwater. Bull World Health Organ. 1973;49(6):559-66.2. Wang G, Deng G, Shi J, Luo W, Zhang G, Zhang Q, et al. H6influenza viruses pose a potential threat to human health. J Virol.2014;88:3953–64. http://dx.doi.org/10.1128/JVI.03292-133. Jiao P, Yuan R, Wei L, Jia B, Cao L, Song Y, et al. Completegenomic sequence of a novel natural recombinant H6N2 influenzavirus from chickens in Guangdong, Southern China. J Virol.2012;86:7717–8. http://dx.doi.org/10.1128/JVI.00963-124. Zhao G, Lu X, Gu X, Zhao K, Song Q, Pan J, et al. Molecularevolution of the H6 subtype influenza A viruses from poultry ineastern China from 2002 to 2010. Virol J. 2011;8:470.http://dx.doi.org/10.1186/1743-422X-8-4705. Pepin KM, Wang J, Webb CT, Smith GJ, Poss M, Hudson PJ, et al.Multiannual patterns of influenza A transmission in Chinese livebird market systems. Influenza Other Respir Viruses. 2013;7:97–107. http://dx.doi.org/10.1111/j.1750-2659.2012.00354.x6. Yuan J, Zhang L, Kan X, Jiang L, Yang J, Guo Z, et al. Originand molecular characteristics of a novel 2013 avian influenzaA(H6N1) virus causing human infection in Taiwan. Clin Infect Dis.2013;57:1367–8. http://dx.doi.org/10.1093/cid/cit479Samuel M.S. Chan, 1 Batchuluun Damdinjav, 1Ranawaka A.P.M. Perera, 1 Daniel K.W. Chu, 1Bodisaikhan Khishgee, Bazarragchaa Enkhbold,Leo L.M. Poon, Malik PeirisAuthor affiliations: The University of Hong Kong, Hong Kong,China (S.M.S. Chan, R.A.P.M. Perera, D.K.W. Chu, L.L.M. Poon,M. Peiris); Transboundary State Central Veterinary Laboratory,Ulaanbaatar, Mongolia (B. Damdinjav, B. Khishgee, B. Enkhbold)DOI: http://dx.doi.org/10.3201/eid2107.150178To the Editor: Middle East respiratory syndromecoronavirus (MERS-CoV) was first identified among humansin 2012 in Saudi Arabia (1). As of February 5, 2015,a total of 971 MERS cases and 356 associated deaths hadbeen confirmed (2). Because MERS is a zoonotic disease, itis essential that the animal reservoirs and hosts that sustainvirus circulation in nature be identified.Seroepidemiologic and virologic studies have demonstratedevidence of MERS-CoV infection in dromedarycamels (Camelus dromedarius) in the Arabian Peninsula(3), and viruses isolated from dromedaries appear capableof infecting the human respiratory tract (4). In some instances,MERS-CoV infection in dromedaries has precededinfection in humans (5), indicating that dromedariesare a natural host for MERS-CoV and a possible sourceof human infection. Thus, it is important to define thegeographic range of MERS-CoV infection in camels andthe species of camelids that are infected by MERS-CoVin nature.Two species of camels exist: 1-hump dromedaries (C.dromedarius) and 2-hump Bactrian camels (C. bactrianus).1These authors contributed equally to the article.Emerging Infectious Diseases • www.cdc.gov/eid • Vol. 21, No. 7, July 2015 1269
- Page 3 and 4:
July 2015SynopsisOn the CoverMarian
- Page 5 and 6:
1240 Gastroenteritis OutbreaksCause
- Page 7 and 8:
SYNOPSISDisseminated Infections wit
- Page 9 and 10:
Disseminated Infections with Talaro
- Page 11 and 12:
Disseminated Infections with Talaro
- Page 13 and 14:
Macacine Herpesvirus 1 inLong-Taile
- Page 15 and 16:
Macacine Herpesvirus 1 in Macaques,
- Page 17 and 18:
Macacine Herpesvirus 1 in Macaques,
- Page 19:
Macacine Herpesvirus 1 in Macaques,
- Page 23:
Malaria among Young Infants, Africa
- Page 26 and 27:
RESEARCHFigure 3. Dynamics of 19-kD
- Page 28 and 29:
Transdermal Diagnosis of MalariaUsi
- Page 30 and 31:
RESEARCHFigure 2. A) Acoustic trace
- Page 32 and 33:
RESEARCHof malaria-infected mosquit
- Page 34 and 35:
Lack of Transmission amongClose Con
- Page 36 and 37:
RESEARCH(IFA) and microneutralizati
- Page 38 and 39:
RESEARCHoropharyngeal, and serum sa
- Page 40 and 41:
RESEARCH6. Assiri A, McGeer A, Perl
- Page 42 and 43:
RESEARCHadvanced genomic sequencing
- Page 44 and 45:
RESEARCHTable 2. Next-generation se
- Page 46 and 47:
RESEARCHTable 3. Mutation analysis
- Page 48 and 49:
RESEARCHReferences1. Baize S, Panne
- Page 50 and 51:
Parechovirus Genotype 3 Outbreakamo
- Page 52 and 53:
RESEARCHFigure 1. Venn diagramshowi
- Page 54 and 55:
RESEARCHTable 2. HPeV testing of sp
- Page 56 and 57:
RESEARCHFigure 5. Distribution of h
- Page 58 and 59:
RESEARCHReferences1. Selvarangan R,
- Page 60 and 61:
RESEARCHthe left lobe was sampled b
- Page 62 and 63:
RESEARCHTable 2. Middle East respir
- Page 64 and 65:
RESEARCHseroprevalence in domestic
- Page 66 and 67:
RESEARCHmeasure their current surve
- Page 68 and 69:
RESEARCHTable 2. States with labora
- Page 70 and 71:
RESEARCHFigure 2. Comparison of sur
- Page 72 and 73:
RESEARCH9. Centers for Disease Cont
- Page 74 and 75:
RESEARCHthe analyses. Cases in pers
- Page 76 and 77:
RESEARCHTable 3. Sampling results (
- Page 78 and 79:
RESEARCHpresence of Legionella spp.
- Page 80 and 81:
Seroprevalence for Hepatitis Eand O
- Page 82 and 83:
RESEARCHTable 1. Description of stu
- Page 84 and 85:
RESEARCHTable 3. Crude and adjusted
- Page 86 and 87:
RESEARCHrates by gender or HIV stat
- Page 88 and 89:
RESEARCH25. Taha TE, Kumwenda N, Ka
- Page 90 and 91:
POLICY REVIEWDutch Consensus Guidel
- Page 92 and 93:
POLICY REVIEWTable 3. Comparison of
- Page 94 and 95:
POLICY REVIEW6. Botelho-Nevers E, F
- Page 96 and 97:
DISPATCHESFigure 1. Phylogenetic tr
- Page 98 and 99:
DISPATCHESSevere Pediatric Adenovir
- Page 100 and 101:
DISPATCHESTable 1. Demographics and
- Page 102 and 103:
DISPATCHES13. Kim YJ, Hong JY, Lee
- Page 104 and 105:
DISPATCHESTable. Alignment of resid
- Page 106 and 107:
DISPATCHESFigure 2. Interaction of
- Page 108 and 109:
DISPATCHESSchmallenberg Virus Recur
- Page 110 and 111:
DISPATCHESFigure 2. Detection of Sc
- Page 112 and 113:
DISPATCHESFigure 1. Histopathologic
- Page 114:
DISPATCHESFigure 2. Detection of fo
- Page 117 and 118:
Influenza Virus Strains in the Amer
- Page 119 and 120:
Novel Arenavirus Isolates from Nama
- Page 121 and 122:
Novel Arenaviruses, Southern Africa
- Page 123 and 124: Readability of Ebola Informationon
- Page 125 and 126: Readability of Ebola Information on
- Page 127 and 128: Patients under investigation for ME
- Page 129 and 130: Patients under investigation for ME
- Page 131 and 132: Wildlife Reservoir for Hepatitis E
- Page 133 and 134: Asymptomatic Malaria and Other Infe
- Page 135 and 136: Asymptomatic Malaria in Children fr
- Page 137 and 138: Bufavirus in Wild Shrews and Nonhum
- Page 139 and 140: Bufavirus in Wild Shrews and Nonhum
- Page 141 and 142: Range Expansion for Rat Lungworm in
- Page 143 and 144: Slow Clearance of Plasmodium falcip
- Page 145 and 146: Slow Clearance of Plasmodium falcip
- Page 147 and 148: Gastroenteritis Caused by Norovirus
- Page 149 and 150: Ebola Virus Stability on Surfaces a
- Page 151 and 152: Ebola Virus Stability on Surfaces a
- Page 153 and 154: Outbreak of Ciprofloxacin-Resistant
- Page 155 and 156: Outbreak of S. sonnei, South KoreaT
- Page 157 and 158: Rapidly Expanding Range of Highly P
- Page 159 and 160: Cluster of Ebola Virus Disease, Bon
- Page 161 and 162: Cluster of Ebola Virus Disease, Lib
- Page 163 and 164: ANOTHER DIMENSIONThe Past Is Never
- Page 165 and 166: Measles Epidemic, Boston, Massachus
- Page 167 and 168: LETTERSInfluenza A(H5N6)Virus Reass
- Page 169 and 170: LETTERSsystem (8 kb-span paired-end
- Page 171 and 172: LETTERS3. Van Hong N, Amambua-Ngwa
- Page 173: LETTERSTable. Prevalence of Bartone
- Page 177 and 178: LETTERSprovinces and a total of 200
- Page 179 and 180: LETTERS7. Manian FA. Bloodstream in
- Page 181 and 182: LETTERSforward projections. N Engl
- Page 183 and 184: LETTERS3. Guindon S, Gascuel OA. Si
- Page 185 and 186: BOOKS AND MEDIAin the port cities o
- Page 187 and 188: ABOUT THE COVERNorth was not intere
- Page 189 and 190: Earning CME CreditTo obtain credit,
- Page 191: Emerging Infectious Diseases is a p