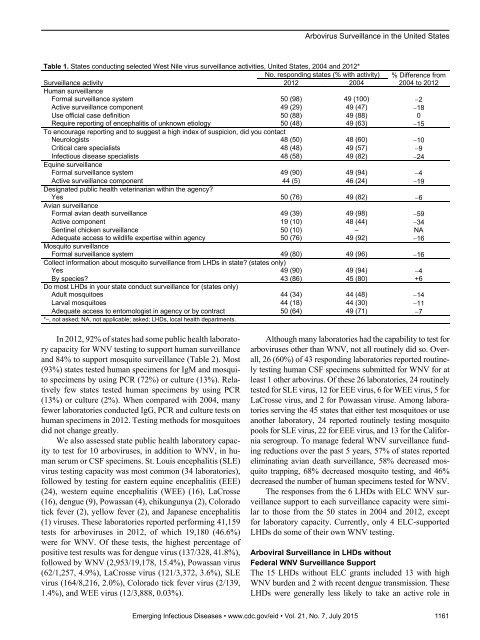
RESEARCHmeasure their current surveillance and staffing capacity forWNV and other arboviruses and compare findings withthose from the 2004 assessment (19). Its objectives wereto describe 1) national capacities for surveillance for WNVand other arboviruses in the 50 states and 6 ELC-fundedLHDs in 2012 and changes since 2004; 2) surveillance capacitiesof LHDs with historically high WNV burdens butno direct federal funding and how they compare with thosein ELC-supported LHDs; and 3) the outstanding needs tobring US arbovirus surveillance to full capacity.MethodsThe assessment tool was developed by a working groupthat included representatives from CSTE, the Associationof State and Territorial Health Officials, the National Associationof County and City Health Officials, the Associationof Public Health Laboratories, the CDC Divisionof Vector-Borne Diseases, and Emory University. Theworking group developed the 2013 survey by modifyingthe 2004 assessment tool and adding unique questions thatreflected new WNV surveillance, prevention, and controlguidance (20) and assessed specific staffing needs, presenceof Aedes aegypti mosquitoes, and effect of federalWNV surveillance funding reductions on WNV surveillanceactivities over the past 5 years.After pilot studies in 7 states and 4 LHDs, CSTEemailed the final state survey to the 50 state health departmentsand instructed key respondents to obtain relevantinformation from laboratory and mosquito surveillanceand control staff, and complete the assessment online.The Epi Info Web Survey System was used to collect responses(21). CSTE used a similar process for distributingthe assessment to 30 large city/county health departmentsthat met at least 1 of 3 criteria: 1) receive supplementalWNV surveillance funding through the ELC grant (n = 6[Washington, DC; New York, NY; Los Angeles County,CA; Chicago, IL; Houston, TX; and Philadelphia, PA); 2)had at least 100 cumulative reported cases of WNV neuroinvasivedisease during 1999–2012 (n = 22, excluding 4of the ELC-funded LHDs); or 3) had recent local denguetransmission (n = 2).The 2 assessments were analyzed separately. Frequenciesof response to each question were examined inaggregate and by groupings of state health departmentson the basis of whether they reported a need for additionalstaff. LHDs were grouped by whether they received federalWNV surveillance funding, which was referred to asELC-supported. Additional need to achieve full capacitywas based on response to the question, “How many additionalFTE (full-time equivalent) staff-persons are neededat the state level in your state to achieve full epidemiologyand laboratory capacity to conduct WNV and othermosquito-borne disease surveillance?” Full capacity wasdefined as 1) ability to complete a standard case reportform on every suspected/confirmed mosquito-borne arboviraldisease case and report it to ArboNET; 2) abilityto test for IgM for all relevant arboviruses (includingdengue) on any cerebrospinal fluid (CSF) or serum specimensubmitted to the state or city/county laboratory fora suspected case of arboviral disease); and 3) having anenvironmental surveillance system that includes mosquitosurveillance to “routinely monitor arboviral activityin all parts of the jurisdiction in which there is the potentialfor human outbreaks of arboviral disease based onpast experience.”For staffing-related questions, nonresponses werecoded as no staff needed. For all other questions, nonresponseswere assumed to be missing responses. Differencesof >10% between groups being compared were deemedfunctionally useful and are highlighted in the results. Dataanalysis was performed by using Microsoft Excel (Microsoft,Redmond, WA, USA) and Epi Info <strong>version</strong> 7 (CDC,Atlanta, GA, USA).ResultsAll 50 states (100%), all 6 ELC-supported LHDs (100%),and 15 LHDs without ELC support (62.5%) responded.In 2012, nearly all states (98%) conducted surveillancefor human WNV disease; fewer conducted WNV-relatedsurveillance for equine disease (90%), mosquitoes(80%), and avian deaths (39%) (Table 1). Less than 60%of jurisdictions contacted medical specialists (neurologists,critical care, infectious disease) to encourage reportingof suspected WNV cases, and less than one thirdhad an active surveillance component for human surveillance.Although only 80% of states conducted mosquitosurveillance, 90% collected information about mosquitosurveillance from LHDs in their state, including 86% bymosquito species. Overall, 46 (94%) states had at leastsome information on mosquito populations, either bycollecting it themselves or from LHDs. It took a medianof 6 days (range 1.5–17 days) from the date a WNVpositivehuman specimen was collected for data to be reportedto the WNV surveillance program, and a medianof 16.5 days (range 4–45 days) from date of onset to datereported to ArboNET.Fewer jurisdictions in 2012 than in 2004 conductedWNV-related surveillance activities, particularly aviandeaths (26 states, −59%), active human surveillance (9states –18%), contact with infectious disease specialists(12 states, –24%), and state-level mosquito surveillance (8states, –16%). In addition, the percentage of states respondingthat most LHDs in their state conducted adult mosquitosurveillance decreased from 48% to 34% (Table 1). Therewas a slight improvement in timeliness of reporting, from amedian of 7 days to 6 days.1160 Emerging Infectious Diseases • www.cdc.gov/eid • Vol. 21, No. 7, July 2015
Arbovirus Surveillance in the United StatesTable 1. States conducting selected West Nile virus surveillance activities, United States, 2004 and 2012*No. responding states (% with activity) % Difference fromSurveillance activity2012 20042004 to 2012Human surveillanceFormal surveillance system 50 (98) 49 (100) 2Active surveillance component 49 (29) 49 (47) 18Use official case definition 50 (88) 49 (88) 0Require reporting of encephalitis of unknown etiology 50 (48) 49 (63) 15To encourage reporting and to suggest a high index of suspicion, did you contactNeurologists 48 (50) 48 (60) 10Critical care specialists 48 (48) 49 (57) 9Infectious disease specialists 48 (58) 49 (82) 24Equine surveillanceFormal surveillance system 49 (90) 49 (94) 4Active surveillance component 44 (5) 46 (24) 19Designated public health veterinarian within the agency?Yes 50 (76) 49 (82) 6Avian surveillanceFormal avian death surveillance 49 (39) 49 (98) 59Active component 19 (10) 48 (44) 34Sentinel chicken surveillance 50 (10) – NAAdequate access to wildlife expertise within agency 50 (76) 49 (92) 16Mosquito surveillanceFormal surveillance system 49 (80) 49 (96) 16Collect information about mosquito surveillance from LHDs in state? (states only)Yes 49 (90) 49 (94) 4By species? 43 (86) 45 (80) +6Do most LHDs in your state conduct surveillance for (states only)Adult mosquitoes 44 (34) 44 (48) 14Larval mosquitoes 44 (18) 44 (30) 11Adequate access to entomologist in agency or by contract 50 (64) 49 (71) 7*–, not asked; NA, not applicable; asked; LHDs, local health departments.In 2012, 92% of states had some public health laboratorycapacity for WNV testing to support human surveillanceand 84% to support mosquito surveillance (Table 2). Most(93%) states tested human specimens for IgM and mosquitospecimens by using PCR (72%) or culture (13%). Relativelyfew states tested human specimens by using PCR(13%) or culture (2%). When compared with 2004, manyfewer laboratories conducted IgG, PCR and culture tests onhuman specimens in 2012. Testing methods for mosquitoesdid not change greatly.We also assessed state public health laboratory capacityto test for 10 arboviruses, in addition to WNV, in humanserum or CSF specimens. St. Louis encephalitis (SLE)virus testing capacity was most common (34 laboratories),followed by testing for eastern equine encephalitis (EEE)(24), western equine encephalitis (WEE) (16), LaCrosse(16), dengue (9), Powassan (4), chikungunya (2), Coloradotick fever (2), yellow fever (2), and Japanese encephalitis(1) viruses. These laboratories reported performing 41,159tests for arboviruses in 2012, of which 19,180 (46.6%)were for WNV. Of these tests, the highest percentage ofpositive test results was for dengue virus (137/328, 41.8%),followed by WNV (2,953/19,178, 15.4%), Powassan virus(62/1,257, 4.9%), LaCrosse virus (121/3,372, 3.6%), SLEvirus (164/8,216, 2.0%), Colorado tick fever virus (2/139,1.4%), and WEE virus (12/3,888, 0.03%).Although many laboratories had the capability to test forarboviruses other than WNV, not all routinely did so. Overall,26 (60%) of 43 responding laboratories reported routinelytesting human CSF specimens submitted for WNV for atleast 1 other arbovirus. Of these 26 laboratories, 24 routinelytested for SLE virus, 12 for EEE virus, 6 for WEE virus, 5 forLaCrosse virus, and 2 for Powassan viruse. Among laboratoriesserving the 45 states that either test mosquitoes or useanother laboratory, 24 reported routinely testing mosquitopools for SLE virus, 22 for EEE virus, and 13 for the Californiaserogroup. To manage federal WNV surveillance fundingreductions over the past 5 years, 57% of states reportedeliminating avian death surveillance, 58% decreased mosquitotrapping, 68% decreased mosquito testing, and 46%decreased the number of human specimens tested for WNV.The responses from the 6 LHDs with ELC WNV surveillancesupport to each surveillance capacity were similarto those from the 50 states in 2004 and 2012, exceptfor laboratory capacity. Currently, only 4 ELC-supportedLHDs do some of their own WNV testing.Arboviral Surveillance in LHDs withoutFederal WNV Surveillance SupportThe 15 LHDs without ELC grants included 13 with highWNV burden and 2 with recent dengue transmission. TheseLHDs were generally less likely to take an active role inEmerging Infectious Diseases • www.cdc.gov/eid • Vol. 21, No. 7, July 2015 1161
- Page 3 and 4:
July 2015SynopsisOn the CoverMarian
- Page 5 and 6:
1240 Gastroenteritis OutbreaksCause
- Page 7 and 8:
SYNOPSISDisseminated Infections wit
- Page 9 and 10:
Disseminated Infections with Talaro
- Page 11 and 12:
Disseminated Infections with Talaro
- Page 13 and 14:
Macacine Herpesvirus 1 inLong-Taile
- Page 15 and 16: Macacine Herpesvirus 1 in Macaques,
- Page 17 and 18: Macacine Herpesvirus 1 in Macaques,
- Page 19: Macacine Herpesvirus 1 in Macaques,
- Page 23: Malaria among Young Infants, Africa
- Page 26 and 27: RESEARCHFigure 3. Dynamics of 19-kD
- Page 28 and 29: Transdermal Diagnosis of MalariaUsi
- Page 30 and 31: RESEARCHFigure 2. A) Acoustic trace
- Page 32 and 33: RESEARCHof malaria-infected mosquit
- Page 34 and 35: Lack of Transmission amongClose Con
- Page 36 and 37: RESEARCH(IFA) and microneutralizati
- Page 38 and 39: RESEARCHoropharyngeal, and serum sa
- Page 40 and 41: RESEARCH6. Assiri A, McGeer A, Perl
- Page 42 and 43: RESEARCHadvanced genomic sequencing
- Page 44 and 45: RESEARCHTable 2. Next-generation se
- Page 46 and 47: RESEARCHTable 3. Mutation analysis
- Page 48 and 49: RESEARCHReferences1. Baize S, Panne
- Page 50 and 51: Parechovirus Genotype 3 Outbreakamo
- Page 52 and 53: RESEARCHFigure 1. Venn diagramshowi
- Page 54 and 55: RESEARCHTable 2. HPeV testing of sp
- Page 56 and 57: RESEARCHFigure 5. Distribution of h
- Page 58 and 59: RESEARCHReferences1. Selvarangan R,
- Page 60 and 61: RESEARCHthe left lobe was sampled b
- Page 62 and 63: RESEARCHTable 2. Middle East respir
- Page 64 and 65: RESEARCHseroprevalence in domestic
- Page 68 and 69: RESEARCHTable 2. States with labora
- Page 70 and 71: RESEARCHFigure 2. Comparison of sur
- Page 72 and 73: RESEARCH9. Centers for Disease Cont
- Page 74 and 75: RESEARCHthe analyses. Cases in pers
- Page 76 and 77: RESEARCHTable 3. Sampling results (
- Page 78 and 79: RESEARCHpresence of Legionella spp.
- Page 80 and 81: Seroprevalence for Hepatitis Eand O
- Page 82 and 83: RESEARCHTable 1. Description of stu
- Page 84 and 85: RESEARCHTable 3. Crude and adjusted
- Page 86 and 87: RESEARCHrates by gender or HIV stat
- Page 88 and 89: RESEARCH25. Taha TE, Kumwenda N, Ka
- Page 90 and 91: POLICY REVIEWDutch Consensus Guidel
- Page 92 and 93: POLICY REVIEWTable 3. Comparison of
- Page 94 and 95: POLICY REVIEW6. Botelho-Nevers E, F
- Page 96 and 97: DISPATCHESFigure 1. Phylogenetic tr
- Page 98 and 99: DISPATCHESSevere Pediatric Adenovir
- Page 100 and 101: DISPATCHESTable 1. Demographics and
- Page 102 and 103: DISPATCHES13. Kim YJ, Hong JY, Lee
- Page 104 and 105: DISPATCHESTable. Alignment of resid
- Page 106 and 107: DISPATCHESFigure 2. Interaction of
- Page 108 and 109: DISPATCHESSchmallenberg Virus Recur
- Page 110 and 111: DISPATCHESFigure 2. Detection of Sc
- Page 112 and 113: DISPATCHESFigure 1. Histopathologic
- Page 114: DISPATCHESFigure 2. Detection of fo
- Page 117 and 118:
Influenza Virus Strains in the Amer
- Page 119 and 120:
Novel Arenavirus Isolates from Nama
- Page 121 and 122:
Novel Arenaviruses, Southern Africa
- Page 123 and 124:
Readability of Ebola Informationon
- Page 125 and 126:
Readability of Ebola Information on
- Page 127 and 128:
Patients under investigation for ME
- Page 129 and 130:
Patients under investigation for ME
- Page 131 and 132:
Wildlife Reservoir for Hepatitis E
- Page 133 and 134:
Asymptomatic Malaria and Other Infe
- Page 135 and 136:
Asymptomatic Malaria in Children fr
- Page 137 and 138:
Bufavirus in Wild Shrews and Nonhum
- Page 139 and 140:
Bufavirus in Wild Shrews and Nonhum
- Page 141 and 142:
Range Expansion for Rat Lungworm in
- Page 143 and 144:
Slow Clearance of Plasmodium falcip
- Page 145 and 146:
Slow Clearance of Plasmodium falcip
- Page 147 and 148:
Gastroenteritis Caused by Norovirus
- Page 149 and 150:
Ebola Virus Stability on Surfaces a
- Page 151 and 152:
Ebola Virus Stability on Surfaces a
- Page 153 and 154:
Outbreak of Ciprofloxacin-Resistant
- Page 155 and 156:
Outbreak of S. sonnei, South KoreaT
- Page 157 and 158:
Rapidly Expanding Range of Highly P
- Page 159 and 160:
Cluster of Ebola Virus Disease, Bon
- Page 161 and 162:
Cluster of Ebola Virus Disease, Lib
- Page 163 and 164:
ANOTHER DIMENSIONThe Past Is Never
- Page 165 and 166:
Measles Epidemic, Boston, Massachus
- Page 167 and 168:
LETTERSInfluenza A(H5N6)Virus Reass
- Page 169 and 170:
LETTERSsystem (8 kb-span paired-end
- Page 171 and 172:
LETTERS3. Van Hong N, Amambua-Ngwa
- Page 173 and 174:
LETTERSTable. Prevalence of Bartone
- Page 175 and 176:
LETTERSavian influenza A(H5N1) viru
- Page 177 and 178:
LETTERSprovinces and a total of 200
- Page 179 and 180:
LETTERS7. Manian FA. Bloodstream in
- Page 181 and 182:
LETTERSforward projections. N Engl
- Page 183 and 184:
LETTERS3. Guindon S, Gascuel OA. Si
- Page 185 and 186:
BOOKS AND MEDIAin the port cities o
- Page 187 and 188:
ABOUT THE COVERNorth was not intere
- Page 189 and 190:
Earning CME CreditTo obtain credit,
- Page 191:
Emerging Infectious Diseases is a p