RESEARCHTable 3. Sampling results (N = 1,484) by potential sources of infection for patients with Legionnaires’ disease, the Netherlands,2002–2012*Samples positive for Legionella spp., no. (%)L. pneumophila L. pneumophila L. nonpneumophilaLegionella spp., no. (%)Samples negative forSource type (no. samples)Total non-SG1SG1Wellness center (37)† 27 (73.0) 4 (10.8) 15 (40.5) 8 (21.6) 10 (27.0)Hospital/health care setting (90) 46 (51.1) 5 (5.6) 23 (25.6) 18 (20.0) 44 (48.9)Cooling tower (43) 19 (44.2) 8 (18.6) 9 (20.9) 2 (4.7) 24 (55.8)Sports facility (29) 10 (34.5) 2 (6.9) 5 (17.2) 3 (10.3) 19 (65.5)Swimming pool (40) 13 (32.5) 2 (5.0) 6 (15.0) 5 (12.5) 27 (67.5)Hotel (20) 8 (40.0) 3 (15.0) 3 (15.0) 2 (10.0) 12 (60.0)Holiday park (23) 5 (21.7) 1(4.3) 2 (8.7) 2 (8.7) 18 (78.3)Residence (762) 155 (20.3) 30 (3.9) 21 (2.8) 104 (13.6) 607 (79.7)Workplace (92) 19 (20.7) 8 (8.7) 2 (2.2) 9 (9.8) 73 (79.3)Car wash/gasoline station (44) 6 (13.6) 1 (2.3) NA 5 (11.4) 38 (86.4)Garden center (86) 8 (9.3) 1 (1.2) 1 (1.2) 6 (7.0) 78 (90.7)Campsite (28) 2 (7.1) 1 (3.6) NA 1 (3.6) 26 (92.9)Decorative fountain (23) 1 (4.3) NA NA 1 (4.3) 22 (95.7)Other (167) 48 (28.7) 10 (6.) 10 (6.0) 28 (16.8) 119 (71.3)Total (1,484) 367 (24.7) 76 (5.1) 97 (6.5) 194 (13.1) 1,117 (75.2)*Study period was August 1, 2002–August 1, 2012. SG1, serogroup 1; NA, not possible to calculate.†Recreational facility offering spas, saunas, fitness equipment, massages, etc.clusters), residences (10 [9.5%] clusters), wellness centers(9 [8.6%] clusters), and hotels (7 [6.7%] clusters) (Table 5).For the 98 location clusters, 142 source investigations wereperformed (23 cluster locations were investigated >1 timeduring the study period). Legionella spp. were found in 56(39.4%) of investigations. L. pneumophila SG1 was foundin 28 (19.7%) investigations, L. pneumophila non-SG1 in6 (4.2%), and Legionella spp. other than L. pneumophilain 22 (15.5%).Strain CharacteristicsFor the 1,991 reported patients with LD, 392 clinical isolatesof Legionella spp. (85% of 460 reported patients diagnosedby culture) were sent to LSIU by the participatingmicrobiologic laboratories in the Netherlands. All L. pneumophilaSG1 clinical isolates and environmental strainswere genotyped by using sequence-based typing (10–12),and monoclonal antibody determination was performed(13) (online Technical Appendix 2 Tables 3, 4).MatchesFor the 392 patients with LD for whom a clinical isolatewas available, 704 unique potential sources of investigationwere identified (mean 1.8 [SD 1.2] sources per patient). Forthese sources, 478 investigations were performed, and Legionellaspp. were found in a sample from 120 (25.1%)investigations.Environmental strains were compared with the clinicalisolate(s) from the patients associated with the sampledpotential sources. During August 2002–August 2012,a total of 38 genotype matches were found for 41 patientswith LD (3 matches involved 2 clinical isolates, and 35matches involved 1 clinical isolate). For each patient withan isolate that was part of a genotype match, a mean of 1.9(SD 1.6) potential sources of infection was identified. Thismean was significantly higher than the mean 1.5 (SD 1.0)sources identified for patients whose clinical isolate couldnot be matched with an environmental strain (independentsamples t-test, p2 persons who were reported to have been exposed to the same potentialsource of infection during the 2–14 days before symptom onset.‡A geographic cluster is defined as cases in >3 persons who lived
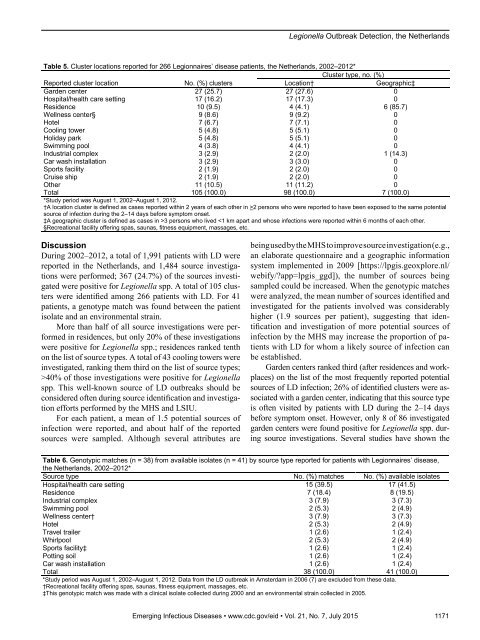
Legionella Outbreak Detection, the NetherlandsTable 5. Cluster locations reported for 266 Legionnaires’ disease patients, the Netherlands, 2002–2012*Cluster type, no. (%)Reported cluster locationNo. (%) clustersLocation†Geographic‡Garden center 27 (25.7) 27 (27.6) 0Hospital/health care setting 17 (16.2) 17 (17.3) 0Residence 10 (9.5) 4 (4.1) 6 (85.7)Wellness center§ 9 (8.6) 9 (9.2) 0Hotel 7 (6.7) 7 (7.1) 0Cooling tower 5 (4.8) 5 (5.1) 0Holiday park 5 (4.8) 5 (5.1) 0Swimming pool 4 (3.8) 4 (4.1) 0Industrial complex 3 (2.9) 2 (2.0) 1 (14.3)Car wash installation 3 (2.9) 3 (3.0) 0Sports facility 2 (1.9) 2 (2.0) 0Cruise ship 2 (1.9) 2 (2.0) 0Other 11 (10.5) 11 (11.2) 0Total 105 (100.0) 98 (100.0) 7 (100.0)*Study period was August 1, 2002–August 1, 2012.†A location cluster is defined as cases reported within 2 years of each other in >2 persons who were reported to have been exposed to the same potentialsource of infection during the 2–14 days before symptom onset.‡A geographic cluster is defined as cases in >3 persons who lived 40% of those investigations were positive for Legionellaspp. This well-known source of LD outbreaks should beconsidered often during source identification and investigationefforts performed by the MHS and LSIU.For each patient, a mean of 1.5 potential sources ofinfection were reported, and about half of the reportedsources were sampled. Although several attributes arebeing used by the MHS to improve source investigation (e.g.,an elaborate questionnaire and a geographic informationsystem implemented in 2009 [https://lpgis.geoxplore.nl/webify/?app=lpgis_ggd]), the number of sources beingsampled could be increased. When the genotypic matcheswere analyzed, the mean number of sources identified andinvestigated for the patients involved was considerablyhigher (1.9 sources per patient), suggesting that identificationand investigation of more potential sources ofinfection by the MHS may increase the proportion of patientswith LD for whom a likely source of infection canbe established.Garden centers ranked third (after residences and workplaces)on the list of the most frequently reported potentialsources of LD infection; 26% of identified clusters were associatedwith a garden center, indicating that this source typeis often visited by patients with LD during the 2–14 daysbefore symptom onset. However, only 8 of 86 investigatedgarden centers were found positive for Legionella spp. duringsource investigations. Several studies have shown theTable 6. Genotypic matches (n = 38) from available isolates (n = 41) by source type reported for patients with Legionnaires’ disease,the Netherlands, 2002–2012*Source type No. (%) matches No. (%) available isolatesHospital/health care setting 15 (39.5) 17 (41.5)Residence 7 (18.4) 8 (19.5)Industrial complex 3 (7.9) 3 (7.3)Swimming pool 2 (5.3) 2 (4.9)Wellness center† 3 (7.9) 3 (7.3)Hotel 2 (5.3) 2 (4.9)Travel trailer 1 (2.6) 1 (2.4)Whirlpool 2 (5.3) 2 (4.9)Sports facility‡ 1 (2.6) 1 (2.4)Potting soil 1 (2.6) 1 (2.4)Car wash installation 1 (2.6) 1 (2.4)Total 38 (100.0) 41 (100.0)*Study period was August 1, 2002–August 1, 2012. Data from the LD outbreak in Amsterdam in 2006 (7) are excluded from these data.†Recreational facility offering spas, saunas, fitness equipment, massages, etc.‡This genotypic match was made with a clinical isolate collected during 2000 and an environmental strain collected in 2005.Emerging Infectious Diseases • www.cdc.gov/eid • Vol. 21, No. 7, July 2015 1171
- Page 3 and 4:
July 2015SynopsisOn the CoverMarian
- Page 5 and 6:
1240 Gastroenteritis OutbreaksCause
- Page 7 and 8:
SYNOPSISDisseminated Infections wit
- Page 9 and 10:
Disseminated Infections with Talaro
- Page 11 and 12:
Disseminated Infections with Talaro
- Page 13 and 14:
Macacine Herpesvirus 1 inLong-Taile
- Page 15 and 16:
Macacine Herpesvirus 1 in Macaques,
- Page 17 and 18:
Macacine Herpesvirus 1 in Macaques,
- Page 19:
Macacine Herpesvirus 1 in Macaques,
- Page 23:
Malaria among Young Infants, Africa
- Page 26 and 27: RESEARCHFigure 3. Dynamics of 19-kD
- Page 28 and 29: Transdermal Diagnosis of MalariaUsi
- Page 30 and 31: RESEARCHFigure 2. A) Acoustic trace
- Page 32 and 33: RESEARCHof malaria-infected mosquit
- Page 34 and 35: Lack of Transmission amongClose Con
- Page 36 and 37: RESEARCH(IFA) and microneutralizati
- Page 38 and 39: RESEARCHoropharyngeal, and serum sa
- Page 40 and 41: RESEARCH6. Assiri A, McGeer A, Perl
- Page 42 and 43: RESEARCHadvanced genomic sequencing
- Page 44 and 45: RESEARCHTable 2. Next-generation se
- Page 46 and 47: RESEARCHTable 3. Mutation analysis
- Page 48 and 49: RESEARCHReferences1. Baize S, Panne
- Page 50 and 51: Parechovirus Genotype 3 Outbreakamo
- Page 52 and 53: RESEARCHFigure 1. Venn diagramshowi
- Page 54 and 55: RESEARCHTable 2. HPeV testing of sp
- Page 56 and 57: RESEARCHFigure 5. Distribution of h
- Page 58 and 59: RESEARCHReferences1. Selvarangan R,
- Page 60 and 61: RESEARCHthe left lobe was sampled b
- Page 62 and 63: RESEARCHTable 2. Middle East respir
- Page 64 and 65: RESEARCHseroprevalence in domestic
- Page 66 and 67: RESEARCHmeasure their current surve
- Page 68 and 69: RESEARCHTable 2. States with labora
- Page 70 and 71: RESEARCHFigure 2. Comparison of sur
- Page 72 and 73: RESEARCH9. Centers for Disease Cont
- Page 74 and 75: RESEARCHthe analyses. Cases in pers
- Page 78 and 79: RESEARCHpresence of Legionella spp.
- Page 80 and 81: Seroprevalence for Hepatitis Eand O
- Page 82 and 83: RESEARCHTable 1. Description of stu
- Page 84 and 85: RESEARCHTable 3. Crude and adjusted
- Page 86 and 87: RESEARCHrates by gender or HIV stat
- Page 88 and 89: RESEARCH25. Taha TE, Kumwenda N, Ka
- Page 90 and 91: POLICY REVIEWDutch Consensus Guidel
- Page 92 and 93: POLICY REVIEWTable 3. Comparison of
- Page 94 and 95: POLICY REVIEW6. Botelho-Nevers E, F
- Page 96 and 97: DISPATCHESFigure 1. Phylogenetic tr
- Page 98 and 99: DISPATCHESSevere Pediatric Adenovir
- Page 100 and 101: DISPATCHESTable 1. Demographics and
- Page 102 and 103: DISPATCHES13. Kim YJ, Hong JY, Lee
- Page 104 and 105: DISPATCHESTable. Alignment of resid
- Page 106 and 107: DISPATCHESFigure 2. Interaction of
- Page 108 and 109: DISPATCHESSchmallenberg Virus Recur
- Page 110 and 111: DISPATCHESFigure 2. Detection of Sc
- Page 112 and 113: DISPATCHESFigure 1. Histopathologic
- Page 114: DISPATCHESFigure 2. Detection of fo
- Page 117 and 118: Influenza Virus Strains in the Amer
- Page 119 and 120: Novel Arenavirus Isolates from Nama
- Page 121 and 122: Novel Arenaviruses, Southern Africa
- Page 123 and 124: Readability of Ebola Informationon
- Page 125 and 126: Readability of Ebola Information on
- Page 127 and 128:
Patients under investigation for ME
- Page 129 and 130:
Patients under investigation for ME
- Page 131 and 132:
Wildlife Reservoir for Hepatitis E
- Page 133 and 134:
Asymptomatic Malaria and Other Infe
- Page 135 and 136:
Asymptomatic Malaria in Children fr
- Page 137 and 138:
Bufavirus in Wild Shrews and Nonhum
- Page 139 and 140:
Bufavirus in Wild Shrews and Nonhum
- Page 141 and 142:
Range Expansion for Rat Lungworm in
- Page 143 and 144:
Slow Clearance of Plasmodium falcip
- Page 145 and 146:
Slow Clearance of Plasmodium falcip
- Page 147 and 148:
Gastroenteritis Caused by Norovirus
- Page 149 and 150:
Ebola Virus Stability on Surfaces a
- Page 151 and 152:
Ebola Virus Stability on Surfaces a
- Page 153 and 154:
Outbreak of Ciprofloxacin-Resistant
- Page 155 and 156:
Outbreak of S. sonnei, South KoreaT
- Page 157 and 158:
Rapidly Expanding Range of Highly P
- Page 159 and 160:
Cluster of Ebola Virus Disease, Bon
- Page 161 and 162:
Cluster of Ebola Virus Disease, Lib
- Page 163 and 164:
ANOTHER DIMENSIONThe Past Is Never
- Page 165 and 166:
Measles Epidemic, Boston, Massachus
- Page 167 and 168:
LETTERSInfluenza A(H5N6)Virus Reass
- Page 169 and 170:
LETTERSsystem (8 kb-span paired-end
- Page 171 and 172:
LETTERS3. Van Hong N, Amambua-Ngwa
- Page 173 and 174:
LETTERSTable. Prevalence of Bartone
- Page 175 and 176:
LETTERSavian influenza A(H5N1) viru
- Page 177 and 178:
LETTERSprovinces and a total of 200
- Page 179 and 180:
LETTERS7. Manian FA. Bloodstream in
- Page 181 and 182:
LETTERSforward projections. N Engl
- Page 183 and 184:
LETTERS3. Guindon S, Gascuel OA. Si
- Page 185 and 186:
BOOKS AND MEDIAin the port cities o
- Page 187 and 188:
ABOUT THE COVERNorth was not intere
- Page 189 and 190:
Earning CME CreditTo obtain credit,
- Page 191:
Emerging Infectious Diseases is a p