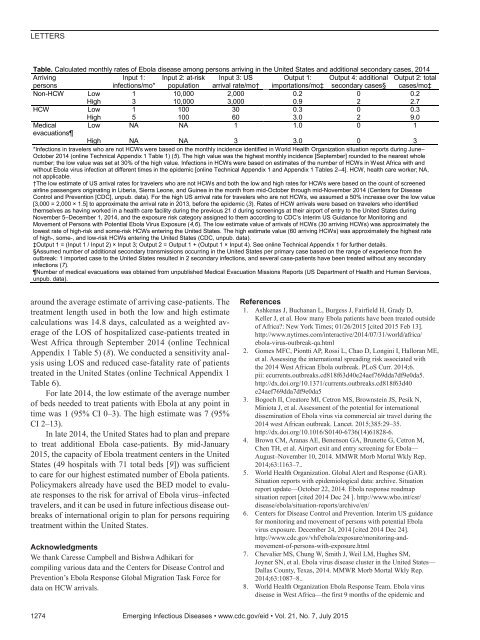
LETTERSTable. Calculated monthly rates of Ebola disease among persons arriving in the United States and additional secondary cases, 2014ArrivingInput 1: Input 2: at-risk Input 3: US Output 1: Output 4: additional Output 2: totalpersonsinfections/mo* population arrival rate/mo† importations/mo‡ secondary cases§ cases/mo‡Non-HCW Low 1 10,000 2,000 0.2 0 0.2High 3 10,000 3,000 0.9 2 2.7HCW Low 1 100 30 0.3 0 0.3High 5 100 60 3.0 2 9.0Medical Low NA NA 1 1.0 0 1evacuationsHigh NA NA 3 3.0 0 3*Infections in travelers who are not HCWs were based on the monthly incidence identified in World Health Organization situation reports during June–October 2014 (online Technical Appendix 1 Table 1) (5). The high value was the highest monthly incidence [September] rounded to the nearest wholenumber; the low value was set at 30% of the high value. Infections in HCWs were based on estimates of the number of HCWs in West Africa with andwithout Ebola virus infection at different times in the epidemic [online Technical Appendix 1 and Appendix 1 Tables 2–4]. HCW, health care worker; NA,not applicable.†The low estimate of US arrival rates for travelers who are not HCWs and both the low and high rates for HCWs were based on the count of screenedairline passengers originating in Liberia, Sierra Leone, and Guinea in the month from mid-October through mid-November 2014 (Centers for DiseaseControl and Prevention [CDC], unpub. data). For the high US arrival rate for travelers who are not HCWs, we assumed a 50% increase over the low value[3,000 = 2,000 × 1.5] to approximate the arrival rate in 2013, before the epidemic (3). Rates of HCW arrivals were based on travelers who identifiedthemselves as having worked in a health care facility during the previous 21 d during screenings at their airport of entry to the United States duringNovember 5–December 1, 2014, and the exposure risk category assigned to them according to CDC’s Interim US Guidance for Monitoring andMovement of Persons with Potential Ebola Virus Exposure (4,6). The low estimate value of arrivals of HCWs (30 arriving HCWs) was approximately thelowest rate of high-risk and some-risk HCWs entering the United States. The high estimate value (60 arriving HCWs) was approximately the highest rateof high-, some-, and low-risk HCWs entering the United States (CDC, unpub. data).‡Output 1 = (Input 1 / Input 2) × Input 3; Output 2 = Output 1 + (Output 1 × Input 4). See online Technical Appendix 1 for further details.§Assumed number of additional secondary transmissions occurring in the United States per primary case based on the range of experience from theoutbreak: 1 imported case to the United States resulted in 2 secondary infections, and several case-patients have been treated without any secondaryinfections (7).Number of medical evacuations was obtained from unpublished Medical Evacuation Missions Reports (US Department of Health and Human Services,unpub. data).around the average estimate of arriving case-patients. Thetreatment length used in both the low and high estimatecalculations was 14.8 days, calculated as a weighted averageof the LOS of hospitalized case-patients treated inWest Africa through September 2014 (online TechnicalAppendix 1 Table 5) (8). We conducted a sensitivity analysisusing LOS and reduced case-fatality rate of patientstreated in the United States (online Technical Appendix 1Table 6).For late 2014, the low estimate of the average numberof beds needed to treat patients with Ebola at any point intime was 1 (95% CI 0–3). The high estimate was 7 (95%CI 2–13).In late 2014, the United States had to plan and prepareto treat additional Ebola case-patients. By mid-January2015, the capacity of Ebola treatment centers in the UnitedStates (49 hospitals with 71 total beds [9]) was sufficientto care for our highest estimated number of Ebola patients.Policymakers already have used the BED model to evaluateresponses to the risk for arrival of Ebola virus–infectedtravelers, and it can be used in future infectious disease outbreaksof international origin to plan for persons requiringtreatment within the United States.AcknowledgmentsWe thank Caresse Campbell and Bishwa Adhikari forcompiling various data and the Centers for Disease Control andPrevention’s Ebola Response Global Migration Task Force fordata on HCW arrivals.References1. Ashkenas J, Buchanan L, Burgess J, Fairfield H, Grady D,Keller J, et al. How many Ebola patients have been treated outsideof Africa?: New York Times; 01/26/2015 [cited 2015 Feb 13].http://www.nytimes.com/interactive/2014/07/31/world/africa/ebola-virus-outbreak-qa.html2. Gomes MFC, Piontti AP, Rossi L, Chao D, Longini I, Halloran ME,et al. Assessing the international spreading risk associated withthe 2014 West African Ebola outbreak. PLoS Curr. 2014;6.pii: ecurrents.outbreaks.cd818f63d40e24aef769dda7df9e0da5.http://dx.doi.org/10.1371/currents.outbreaks.cd818f63d40e24aef769dda7df9e0da53. Bogoch II, Creatore MI, Cetron MS, Brownstein JS, Pesik N,Miniota J, et al. Assessment of the potential for internationaldissemination of Ebola virus via commercial air travel during the2014 west African outbreak. Lancet. 2015;385:29–35.http://dx.doi.org/10.1016/S0140-6736(14)61828-6.4. Brown CM, Aranas AE, Benenson GA, Brunette G, Cetron M,Chen TH, et al. Airport exit and entry screening for Ebola—August–November 10, 2014. MMWR Morb Mortal Wkly Rep.2014;63:1163–7..5. World Health Organization. Global Alert and Response (GAR).Situation reports with epidemiological data: archive. Situationreport update—October 22, 2014. Ebola response roadmapsituation report [cited 2014 Dec 24 ]. http://www.who.int/csr/disease/ebola/situation-reports/archive/en/6. Centers for Disease Control and Prevention. Interim US guidancefor monitoring and movement of persons with potential Ebolavirus exposure. December 24, 2014 [cited 2014 Dec 24].http://www.cdc.gov/vhf/ebola/exposure/monitoring-andmovement-of-persons-with-exposure.html7. Chevalier MS, Chung W, Smith J, Weil LM, Hughes SM,Joyner SN, et al. Ebola virus disease cluster in the United States—Dallas County, Texas, 2014. MMWR Morb Mortal Wkly Rep.2014;63:1087–8..8. World Health Organization Ebola Response Team. Ebola virusdisease in West Africa—the first 9 months of the epidemic and1274 Emerging Infectious Diseases • www.cdc.gov/eid • Vol. 21, No. 7, July 2015
LETTERSforward projections. N Engl J Med. 2014;371:1481–95. Epub 2014Sep 22. http://dx.doi.org/10.1056/NEJMoa1411100.9. Centers for Disease Control and Prevention. Current Ebola treatmentcenters. 12/31/2014 [cited 2014 Jan 5]. http://www.cdc.gov/vhf/ebola/healthcare-us/preparing/current-treatment-centers.htmlAddress for correspondence: Gabriel Rainisch, Centers for DiseaseControl and Prevention, 1600 Clifton Rd NE, Mailstop C18, Atlanta, GA30333, USA; email: Grainisch@cdc.govHighly Pathogenic AvianInfluenza A(H5N1) Virus inPoultry, Nigeria, 2015Isabella Monne, 1 Clement Meseko, 1 Tony Joannis,Ismaila Shittu, Mohammed Ahmed, Luca Tassoni,Alice Fusaro, Giovanni CattoliAuthor affiliations: Istituto Zooprofilattico Sperimentale delleVenezie, Padova, Italy (I. Monne, L. Tassoni, A. Fusaro,G. Cattoli); National Veterinary Research Institute, Vom, Nigeria(C. Meseko, T. Joannis, I. Shittu, M. Ahmed)DOI: http://dx.doi.org/10.3201/eid2107.150421To the Editor: In Nigeria, from February 2006 throughJuly 2008, outbreaks of highly pathogenic avian influenza(HPAI) subtype H5N1 virus infection in poultry negativelyaffected animal and public health as well as the agriculturalsector and trade. These outbreaks were caused by virusesbelonging to genetic clades 2.2 and 2.2.1 (1). In January2015, seven years after disappearance of the virus, clinicalsigns of HPAI (swollen head and wattles, hemorrhagicshank and feet) and increased mortality rates were observedamong backyard poultry in Kano and in a live bird marketin Lagos State, Nigeria. The virus was isolated from 2 samplesindependently collected from the poultry farm (parenchymatoustissues) and the market (tracheal swab), andH5 subtype virus was identified by reverse transcriptionPCR. The samples were adsorbed onto 2 Flinders TechnologyAssociates cards (GE Healthcare Life Sciences, LittleChalfont, UK), which were sent to the World Organisationfor Animal Health/Food and Agriculture Organization ofthe United Nations Reference Laboratory for Avian Influenzain Italy for subtype confirmation and genetic characterization.Influenza A(H5N1) virus was detected in bothsamples, and sequencing of the hemagglutinin (HA) geneshowed that the viruses possessed the molecular markersfor HPAI viruses with a multibasic amino acid cleavage sitemotif (PQRERRRKR*G).The complete genome of the virus from backyard poultrywas successfully sequenced from the genetic material1These authors contributed equally to this article.extracted from the Flinders Technology Associates cardsby using an Illumina MiSeq platform (2) and was submittedto the Global Initiative on Sharing All Influenza Datadatabase (http://platform.gisaid.org/) under accession nos.EPI556504 and EPI567299–EPI567305. Maximum-likelihoodtrees were estimated for all 8 gene segments byusing the best-fit general time reversible plus invariant sitesplus gamma 4 model of nucleotide substitution with Phy-ML (3). The topology of the phylogenetic tree of the HAgene demonstrated that the H5N1 virus from Nigeria(A/chicken/Nigeria/15VIR339-2/2015) falls within geneticclade 2.3.2.1c (Figure, panel A). In particular, the HA genesequence clustered with H5 viruses collected in China in2013 and with an H5N1 virus (A/Alberta/01/2014) isolatedfrom a Canada resident who had returned from China (similarity99.3%–99.5%) (4).The remaining 7 genes were closely related to genesof A/Alberta/01/2014(H5N1), although the 2 viruses differedby 32 aa (online Technical Appendix, http://wwwnc.cdc.gov/EID/article/21/7/15-0421-Techapp1.<strong>pdf</strong>). Just asfor the virus from Canada (4), 7 of 8 gene segments of thevirus from Nigeria clustered with HPAI A(H5N1) viruscirculating in Vietnam and China, while the polymerasebasic 2 gene segment (Figure, panel B) resulted fromreassortment with viruses circulating in the same Asiancountries but belonged to the H9N2 subtype. Differingfrom the strain from Canada (only 2 aa mutations comparedwith the 2.3.2.1c candidate vaccine strain; 5), thestrain from Nigeria possesses 6 aa differences: 3 in HA1and 3 in HA2 (online Technical Appendix). The effectof these mutations on the antigenic relatedness of thesestrains should be further explored.Molecular characterization demonstrated that the polymerasebasic 2 sequence contains glutamic acid at position627, establishing the lack of a well-known mammalianadaptation motif (6). Mutations associated with increasedvirulence in mice have been observed in the nonstructuralprotein 1 (P42S, D87E, L98F, I101M, and the 80–84 deletion)and in the matrix 1 proteins (N30D, T215A). In addition,the substitutions D94N, S133A, S155N (H5 numbering)associated with increased binding to α-2,6 sialic acidhave been identified in the HA protein. However, most ofthese substitutions are present in the H5N1 virus sequencesfrom Asia included in our phylogenetic analyses, suggestingthat they may be common among the HPAI H5 virussubtype. Mutations associated with resistance to antiviraldrugs have not been detected (7).The results obtained from whole-genome analysisprovide evidence that a novel clade of the A(H5N1) virus,specifically clade 2.3.2.1c, has reached Nigeria. Althoughascertaining how and exactly when this has happened isdifficult, it seems most likely that the virus entered thecountry in December 2014, as evidenced by unverifiedEmerging Infectious Diseases • www.cdc.gov/eid • Vol. 21, No. 7, July 2015 1275
- Page 3 and 4:
July 2015SynopsisOn the CoverMarian
- Page 5 and 6:
1240 Gastroenteritis OutbreaksCause
- Page 7 and 8:
SYNOPSISDisseminated Infections wit
- Page 9 and 10:
Disseminated Infections with Talaro
- Page 11 and 12:
Disseminated Infections with Talaro
- Page 13 and 14:
Macacine Herpesvirus 1 inLong-Taile
- Page 15 and 16:
Macacine Herpesvirus 1 in Macaques,
- Page 17 and 18:
Macacine Herpesvirus 1 in Macaques,
- Page 19:
Macacine Herpesvirus 1 in Macaques,
- Page 23:
Malaria among Young Infants, Africa
- Page 26 and 27:
RESEARCHFigure 3. Dynamics of 19-kD
- Page 28 and 29:
Transdermal Diagnosis of MalariaUsi
- Page 30 and 31:
RESEARCHFigure 2. A) Acoustic trace
- Page 32 and 33:
RESEARCHof malaria-infected mosquit
- Page 34 and 35:
Lack of Transmission amongClose Con
- Page 36 and 37:
RESEARCH(IFA) and microneutralizati
- Page 38 and 39:
RESEARCHoropharyngeal, and serum sa
- Page 40 and 41:
RESEARCH6. Assiri A, McGeer A, Perl
- Page 42 and 43:
RESEARCHadvanced genomic sequencing
- Page 44 and 45:
RESEARCHTable 2. Next-generation se
- Page 46 and 47:
RESEARCHTable 3. Mutation analysis
- Page 48 and 49:
RESEARCHReferences1. Baize S, Panne
- Page 50 and 51:
Parechovirus Genotype 3 Outbreakamo
- Page 52 and 53:
RESEARCHFigure 1. Venn diagramshowi
- Page 54 and 55:
RESEARCHTable 2. HPeV testing of sp
- Page 56 and 57:
RESEARCHFigure 5. Distribution of h
- Page 58 and 59:
RESEARCHReferences1. Selvarangan R,
- Page 60 and 61:
RESEARCHthe left lobe was sampled b
- Page 62 and 63:
RESEARCHTable 2. Middle East respir
- Page 64 and 65:
RESEARCHseroprevalence in domestic
- Page 66 and 67:
RESEARCHmeasure their current surve
- Page 68 and 69:
RESEARCHTable 2. States with labora
- Page 70 and 71:
RESEARCHFigure 2. Comparison of sur
- Page 72 and 73:
RESEARCH9. Centers for Disease Cont
- Page 74 and 75:
RESEARCHthe analyses. Cases in pers
- Page 76 and 77:
RESEARCHTable 3. Sampling results (
- Page 78 and 79:
RESEARCHpresence of Legionella spp.
- Page 80 and 81:
Seroprevalence for Hepatitis Eand O
- Page 82 and 83:
RESEARCHTable 1. Description of stu
- Page 84 and 85:
RESEARCHTable 3. Crude and adjusted
- Page 86 and 87:
RESEARCHrates by gender or HIV stat
- Page 88 and 89:
RESEARCH25. Taha TE, Kumwenda N, Ka
- Page 90 and 91:
POLICY REVIEWDutch Consensus Guidel
- Page 92 and 93:
POLICY REVIEWTable 3. Comparison of
- Page 94 and 95:
POLICY REVIEW6. Botelho-Nevers E, F
- Page 96 and 97:
DISPATCHESFigure 1. Phylogenetic tr
- Page 98 and 99:
DISPATCHESSevere Pediatric Adenovir
- Page 100 and 101:
DISPATCHESTable 1. Demographics and
- Page 102 and 103:
DISPATCHES13. Kim YJ, Hong JY, Lee
- Page 104 and 105:
DISPATCHESTable. Alignment of resid
- Page 106 and 107:
DISPATCHESFigure 2. Interaction of
- Page 108 and 109:
DISPATCHESSchmallenberg Virus Recur
- Page 110 and 111:
DISPATCHESFigure 2. Detection of Sc
- Page 112 and 113:
DISPATCHESFigure 1. Histopathologic
- Page 114:
DISPATCHESFigure 2. Detection of fo
- Page 117 and 118:
Influenza Virus Strains in the Amer
- Page 119 and 120:
Novel Arenavirus Isolates from Nama
- Page 121 and 122:
Novel Arenaviruses, Southern Africa
- Page 123 and 124:
Readability of Ebola Informationon
- Page 125 and 126:
Readability of Ebola Information on
- Page 127 and 128:
Patients under investigation for ME
- Page 129 and 130: Patients under investigation for ME
- Page 131 and 132: Wildlife Reservoir for Hepatitis E
- Page 133 and 134: Asymptomatic Malaria and Other Infe
- Page 135 and 136: Asymptomatic Malaria in Children fr
- Page 137 and 138: Bufavirus in Wild Shrews and Nonhum
- Page 139 and 140: Bufavirus in Wild Shrews and Nonhum
- Page 141 and 142: Range Expansion for Rat Lungworm in
- Page 143 and 144: Slow Clearance of Plasmodium falcip
- Page 145 and 146: Slow Clearance of Plasmodium falcip
- Page 147 and 148: Gastroenteritis Caused by Norovirus
- Page 149 and 150: Ebola Virus Stability on Surfaces a
- Page 151 and 152: Ebola Virus Stability on Surfaces a
- Page 153 and 154: Outbreak of Ciprofloxacin-Resistant
- Page 155 and 156: Outbreak of S. sonnei, South KoreaT
- Page 157 and 158: Rapidly Expanding Range of Highly P
- Page 159 and 160: Cluster of Ebola Virus Disease, Bon
- Page 161 and 162: Cluster of Ebola Virus Disease, Lib
- Page 163 and 164: ANOTHER DIMENSIONThe Past Is Never
- Page 165 and 166: Measles Epidemic, Boston, Massachus
- Page 167 and 168: LETTERSInfluenza A(H5N6)Virus Reass
- Page 169 and 170: LETTERSsystem (8 kb-span paired-end
- Page 171 and 172: LETTERS3. Van Hong N, Amambua-Ngwa
- Page 173 and 174: LETTERSTable. Prevalence of Bartone
- Page 175 and 176: LETTERSavian influenza A(H5N1) viru
- Page 177 and 178: LETTERSprovinces and a total of 200
- Page 179: LETTERS7. Manian FA. Bloodstream in
- Page 183 and 184: LETTERS3. Guindon S, Gascuel OA. Si
- Page 185 and 186: BOOKS AND MEDIAin the port cities o
- Page 187 and 188: ABOUT THE COVERNorth was not intere
- Page 189 and 190: Earning CME CreditTo obtain credit,
- Page 191: Emerging Infectious Diseases is a p