RESEARCHTable 2. States with laboratory capacity to support WNV and other arboviral surveillance activities, United States, 2004 and 2012*No. responding states (% with activity) % Difference fromLaboratory capacity2012 2004 2004 to 2012OverallHave some in-state capacity for WNV testing 50 (92) – NAHuman surveillanceTest for IgG 46 (48) 47 (72) 24Test for IgM 46 (93) 47 (100) 7Test by culture 46 (2) 47 (19) 17Test by PCR 46 (13) 47 (49) 36Test by PRNT 46 (22) 47 (21) +1Test all CSF specimens submitted for WNV for ≥1 other arbovirus 43 (60) – NAAvian surveillanceTest by culture 46 (4) 47 (13) 9Test by PCR 46 (39) 47 (77) 38Test IgG or IgM 46 (11) 47 (9) +2Test by any of above methods 46 (43) 47 (77) 34Mosquito surveillanceIn-state capacity to test mosquitoes (state or local level) 50 (84) – NATesting for >1 other arbovirus 42 (81) – NACulture or PCR 42 (81) 47 (81) 0Vec Test or RAMP 42 (19) 47 (21) 2*WNV, West Nile virus; –, not asked; NA, not applicable; PRNT, plaque reduction neutralization test; CSF, cerebrospinal fluid; Vec Test, vector test;RAMP, rapid analyte measurement platform.surveillance for human disease or avian deaths than the 6LHDs with ELC WNV surveillance support (Table 3). Furthermore,they were less likely to conduct their own mosquitosurveillance (67% vs. 100%); 5 LHDs did not conductany mosquito surveillance. LHDs that conducted mosquitosurveillance tended to more consistently conduct larval surveillanceand identify trapped mosquitoes to species.Few of these 15 LHDs had their own laboratory capacityto support either testing of human specimens (n =1) or mosquitoes (n = 3) for WNV. Most were dependenton their state health department for this function.Staffing Levels and Need for Additional StaffingA total of 503 persons worked on arbovirus surveillance instate health departments in 2012. Of these, 206 worked atleast half-time on it and 297 worked less than half-time. Overall,40% of those working at least half-time were CDC funded.When converted to FTEs, there were 208.9 FTEs workingon arbovirus surveillance in state health departments in 2012;17% were epidemiologists, 31% laboratory workers, 27%mosquito surveillance staff, and 25% support staff (Table 4).In the 21 LHDs, 187 persons worked on arbovirus surveillancein 2012; a total of 104 worked at least half-timeTable 3. Local health departments conducting selected WNV surveillance activities, by whether they received federal WNVsurveillance funding (ELC) support, United States, 2012*No. responding LHDs (% with activity) % Difference between noSurveillance activityNo ELC support ELC support ELC and some ELC supportHuman surveillanceFormal local-level surveillance system 15 (0) 6 (100) 100To encourage reporting and suggest a high index of suspicion, did you contactNeurologists 15 (33) 6 (83) 50Critical care specialists 15 (47) 6 (83) 36Infectious disease specialists 15 (47) 6 (100) 53Emergency departments 15 (53) 6 (100) 47Equine surveillanceFormal surveillance system 15 (33) 55 (39) 6Designated public health veterinarian within the agency?Yes 15 (33) 6 (50) 17Avian surveillanceFormal avian death surveillance 15 (20) 6 (67) 47Mosquito surveillanceFormal surveillance system 15 (67) 6 (100) 33For larval mosquitoes? 10 (90) 3 (67) +23For adult mosquitoes? 10 (100) 6 (100) 0Identify trapped mosquitoes to species? 10 (90) 6 (83) +7Calculate minimal mosquito infection rates? 10 (50) 6 (83) 33Adequate access to entomologist in agency or by contract 14 (31) 6 (50) 19*WNV, West Nile virus: ELC, epidemiology and laboratory capacity (received specific WNV surveillance funding through the Epidemiology and LaboratoryCapacity Cooperative Agreement); LHDs, local health departments.1162 Emerging Infectious Diseases • www.cdc.gov/eid • Vol. 21, No. 7, July 2015
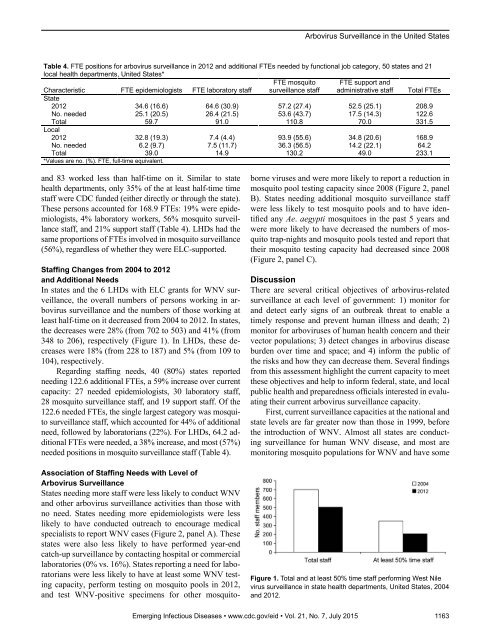
Arbovirus Surveillance in the United StatesTable 4. FTE positions for arbovirus surveillance in 2012 and additional FTEs needed by functional job category, 50 states and 21local health departments, United States*Characteristic FTE epidemiologists FTE laboratory staffFTE mosquitosurveillance staffFTE support andadministrative staff Total FTEsState2012 34.6 (16.6) 64.6 (30.9) 57.2 (27.4) 52.5 (25.1) 208.9No. needed 25.1 (20.5) 26.4 (21.5) 53.6 (43.7) 17.5 (14.3) 122.6Total 59.7 91.0 110.8 70.0 331.5Local2012 32.8 (19.3) 7.4 (4.4) 93.9 (55.6) 34.8 (20.6) 168.9No. needed 6.2 (9.7) 7.5 (11.7) 36.3 (56.5) 14.2 (22.1) 64.2Total 39.0 14.9 130.2 49.0 233.1*Values are no. (%). FTE, full-time equivalent.and 83 worked less than half-time on it. Similar to statehealth departments, only 35% of the at least half-time timestaff were CDC funded (either directly or through the state).These persons accounted for 168.9 FTEs: 19% were epidemiologists,4% laboratory workers, 56% mosquito surveillancestaff, and 21% support staff (Table 4). LHDs had thesame proportions of FTEs involved in mosquito surveillance(56%), regardless of whether they were ELC-supported.Staffing Changes from 2004 to 2012and Additional NeedsIn states and the 6 LHDs with ELC grants for WNV surveillance,the overall numbers of persons working in arbovirussurveillance and the numbers of those working atleast half-time on it decreased from 2004 to 2012. In states,the decreases were 28% (from 702 to 503) and 41% (from348 to 206), respectively (Figure 1). In LHDs, these decreaseswere 18% (from 228 to 187) and 5% (from 109 to104), respectively.Regarding staffing needs, 40 (80%) states reportedneeding 122.6 additional FTEs, a 59% increase over currentcapacity: 27 needed epidemiologists, 30 laboratory staff,28 mosquito surveillance staff, and 19 support staff. Of the122.6 needed FTEs, the single largest category was mosquitosurveillance staff, which accounted for 44% of additionalneed, followed by laboratorians (22%). For LHDs, 64.2 additionalFTEs were needed, a 38% increase, and most (57%)needed positions in mosquito surveillance staff (Table 4).Association of Staffing Needs with Level ofArbovirus SurveillanceStates needing more staff were less likely to conduct WNVand other arbovirus surveillance activities than those withno need. States needing more epidemiologists were lesslikely to have conducted outreach to encourage medicalspecialists to report WNV cases (Figure 2, panel A). Thesestates were also less likely to have performed year-endcatch-up surveillance by contacting hospital or commerciallaboratories (0% vs. 16%). States reporting a need for laboratorianswere less likely to have at least some WNV testingcapacity, perform testing on mosquito pools in 2012,and test WNV-positive specimens for other mosquitoborneviruses and were more likely to report a reduction inmosquito pool testing capacity since 2008 (Figure 2, panelB). States needing additional mosquito surveillance staffwere less likely to test mosquito pools and to have identifiedany Ae. aegypti mosquitoes in the past 5 years andwere more likely to have decreased the numbers of mosquitotrap-nights and mosquito pools tested and report thattheir mosquito testing capacity had decreased since 2008(Figure 2, panel C).DiscussionThere are several critical objectives of arbovirus-relatedsurveillance at each level of government: 1) monitor forand detect early signs of an outbreak threat to enable atimely response and prevent human illness and death; 2)monitor for arboviruses of human health concern and theirvector populations; 3) detect changes in arbovirus diseaseburden over time and space; and 4) inform the public ofthe risks and how they can decrease them. Several findingsfrom this assessment highlight the current capacity to meetthese objectives and help to inform federal, state, and localpublic health and preparedness officials interested in evaluatingtheir current arbovirus surveillance capacity.First, current surveillance capacities at the national andstate levels are far greater now than those in 1999, beforethe introduction of WNV. Almost all states are conductingsurveillance for human WNV disease, and most aremonitoring mosquito populations for WNV and have someFigure 1. Total and at least 50% time staff performing West Nilevirus surveillance in state health departments, United States, 2004and 2012.Emerging Infectious Diseases • www.cdc.gov/eid • Vol. 21, No. 7, July 2015 1163
- Page 3 and 4:
July 2015SynopsisOn the CoverMarian
- Page 5 and 6:
1240 Gastroenteritis OutbreaksCause
- Page 7 and 8:
SYNOPSISDisseminated Infections wit
- Page 9 and 10:
Disseminated Infections with Talaro
- Page 11 and 12:
Disseminated Infections with Talaro
- Page 13 and 14:
Macacine Herpesvirus 1 inLong-Taile
- Page 15 and 16:
Macacine Herpesvirus 1 in Macaques,
- Page 17 and 18: Macacine Herpesvirus 1 in Macaques,
- Page 19: Macacine Herpesvirus 1 in Macaques,
- Page 23: Malaria among Young Infants, Africa
- Page 26 and 27: RESEARCHFigure 3. Dynamics of 19-kD
- Page 28 and 29: Transdermal Diagnosis of MalariaUsi
- Page 30 and 31: RESEARCHFigure 2. A) Acoustic trace
- Page 32 and 33: RESEARCHof malaria-infected mosquit
- Page 34 and 35: Lack of Transmission amongClose Con
- Page 36 and 37: RESEARCH(IFA) and microneutralizati
- Page 38 and 39: RESEARCHoropharyngeal, and serum sa
- Page 40 and 41: RESEARCH6. Assiri A, McGeer A, Perl
- Page 42 and 43: RESEARCHadvanced genomic sequencing
- Page 44 and 45: RESEARCHTable 2. Next-generation se
- Page 46 and 47: RESEARCHTable 3. Mutation analysis
- Page 48 and 49: RESEARCHReferences1. Baize S, Panne
- Page 50 and 51: Parechovirus Genotype 3 Outbreakamo
- Page 52 and 53: RESEARCHFigure 1. Venn diagramshowi
- Page 54 and 55: RESEARCHTable 2. HPeV testing of sp
- Page 56 and 57: RESEARCHFigure 5. Distribution of h
- Page 58 and 59: RESEARCHReferences1. Selvarangan R,
- Page 60 and 61: RESEARCHthe left lobe was sampled b
- Page 62 and 63: RESEARCHTable 2. Middle East respir
- Page 64 and 65: RESEARCHseroprevalence in domestic
- Page 66 and 67: RESEARCHmeasure their current surve
- Page 70 and 71: RESEARCHFigure 2. Comparison of sur
- Page 72 and 73: RESEARCH9. Centers for Disease Cont
- Page 74 and 75: RESEARCHthe analyses. Cases in pers
- Page 76 and 77: RESEARCHTable 3. Sampling results (
- Page 78 and 79: RESEARCHpresence of Legionella spp.
- Page 80 and 81: Seroprevalence for Hepatitis Eand O
- Page 82 and 83: RESEARCHTable 1. Description of stu
- Page 84 and 85: RESEARCHTable 3. Crude and adjusted
- Page 86 and 87: RESEARCHrates by gender or HIV stat
- Page 88 and 89: RESEARCH25. Taha TE, Kumwenda N, Ka
- Page 90 and 91: POLICY REVIEWDutch Consensus Guidel
- Page 92 and 93: POLICY REVIEWTable 3. Comparison of
- Page 94 and 95: POLICY REVIEW6. Botelho-Nevers E, F
- Page 96 and 97: DISPATCHESFigure 1. Phylogenetic tr
- Page 98 and 99: DISPATCHESSevere Pediatric Adenovir
- Page 100 and 101: DISPATCHESTable 1. Demographics and
- Page 102 and 103: DISPATCHES13. Kim YJ, Hong JY, Lee
- Page 104 and 105: DISPATCHESTable. Alignment of resid
- Page 106 and 107: DISPATCHESFigure 2. Interaction of
- Page 108 and 109: DISPATCHESSchmallenberg Virus Recur
- Page 110 and 111: DISPATCHESFigure 2. Detection of Sc
- Page 112 and 113: DISPATCHESFigure 1. Histopathologic
- Page 114: DISPATCHESFigure 2. Detection of fo
- Page 117 and 118: Influenza Virus Strains in the Amer
- Page 119 and 120:
Novel Arenavirus Isolates from Nama
- Page 121 and 122:
Novel Arenaviruses, Southern Africa
- Page 123 and 124:
Readability of Ebola Informationon
- Page 125 and 126:
Readability of Ebola Information on
- Page 127 and 128:
Patients under investigation for ME
- Page 129 and 130:
Patients under investigation for ME
- Page 131 and 132:
Wildlife Reservoir for Hepatitis E
- Page 133 and 134:
Asymptomatic Malaria and Other Infe
- Page 135 and 136:
Asymptomatic Malaria in Children fr
- Page 137 and 138:
Bufavirus in Wild Shrews and Nonhum
- Page 139 and 140:
Bufavirus in Wild Shrews and Nonhum
- Page 141 and 142:
Range Expansion for Rat Lungworm in
- Page 143 and 144:
Slow Clearance of Plasmodium falcip
- Page 145 and 146:
Slow Clearance of Plasmodium falcip
- Page 147 and 148:
Gastroenteritis Caused by Norovirus
- Page 149 and 150:
Ebola Virus Stability on Surfaces a
- Page 151 and 152:
Ebola Virus Stability on Surfaces a
- Page 153 and 154:
Outbreak of Ciprofloxacin-Resistant
- Page 155 and 156:
Outbreak of S. sonnei, South KoreaT
- Page 157 and 158:
Rapidly Expanding Range of Highly P
- Page 159 and 160:
Cluster of Ebola Virus Disease, Bon
- Page 161 and 162:
Cluster of Ebola Virus Disease, Lib
- Page 163 and 164:
ANOTHER DIMENSIONThe Past Is Never
- Page 165 and 166:
Measles Epidemic, Boston, Massachus
- Page 167 and 168:
LETTERSInfluenza A(H5N6)Virus Reass
- Page 169 and 170:
LETTERSsystem (8 kb-span paired-end
- Page 171 and 172:
LETTERS3. Van Hong N, Amambua-Ngwa
- Page 173 and 174:
LETTERSTable. Prevalence of Bartone
- Page 175 and 176:
LETTERSavian influenza A(H5N1) viru
- Page 177 and 178:
LETTERSprovinces and a total of 200
- Page 179 and 180:
LETTERS7. Manian FA. Bloodstream in
- Page 181 and 182:
LETTERSforward projections. N Engl
- Page 183 and 184:
LETTERS3. Guindon S, Gascuel OA. Si
- Page 185 and 186:
BOOKS AND MEDIAin the port cities o
- Page 187 and 188:
ABOUT THE COVERNorth was not intere
- Page 189 and 190:
Earning CME CreditTo obtain credit,
- Page 191:
Emerging Infectious Diseases is a p