Detection and Expression of Biosynthetic Genes in Actinobacteria ...
Detection and Expression of Biosynthetic Genes in Actinobacteria ...
Detection and Expression of Biosynthetic Genes in Actinobacteria ...
You also want an ePaper? Increase the reach of your titles
YUMPU automatically turns print PDFs into web optimized ePapers that Google loves.
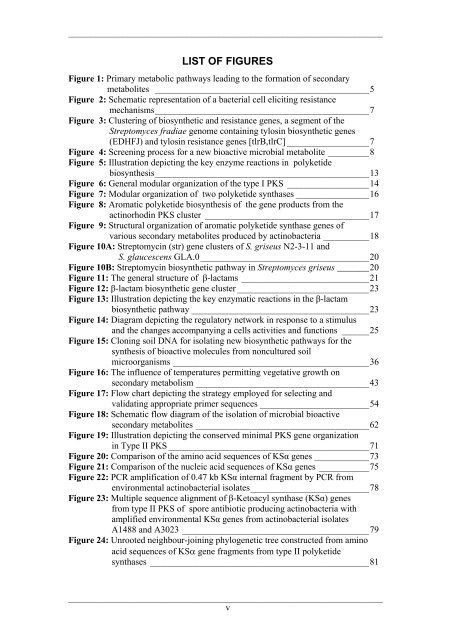
_____________________________________________________________________LIST OF FIGURESFigure 1: Primary metabolic pathways lead<strong>in</strong>g to the formation <strong>of</strong> secondarymetabolites _______________________________________________5Figure 2: Schematic representation <strong>of</strong> a bacterial cell elicit<strong>in</strong>g resistancemechanisms_______________________________________________7Figure 3: Cluster<strong>in</strong>g <strong>of</strong> biosynthetic <strong>and</strong> resistance genes, a segment <strong>of</strong> theStreptomyces fradiae genome conta<strong>in</strong><strong>in</strong>g tylos<strong>in</strong> biosynthetic genes(EDHFJ) <strong>and</strong> tylos<strong>in</strong> resistance genes [tlrB,tlrC] __________________7Figure 4: Screen<strong>in</strong>g process for a new bioactive microbial metabolite _________8Figure 5: Illustration depict<strong>in</strong>g the key enzyme reactions <strong>in</strong> polyketidebiosynthesis_______________________________________________13Figure 6: General modular organization <strong>of</strong> the type I PKS __________________14Figure 7: Modular organization <strong>of</strong> two polyketide synthases ________________16Figure 8: Aromatic polyketide biosynthesis <strong>of</strong> the gene products from theact<strong>in</strong>orhod<strong>in</strong> PKS cluster ____________________________________17Figure 9: Structural organization <strong>of</strong> aromatic polyketide synthase genes <strong>of</strong>various secondary metabolites produced by act<strong>in</strong>obacteria __________18Figure 10A: Streptomyc<strong>in</strong> (str) gene clusters <strong>of</strong> S. griseus N2-3-11 <strong>and</strong>S. glaucescens GLA.0_____________________________________20Figure 10B: Streptomyc<strong>in</strong> biosynthetic pathway <strong>in</strong> Streptomyces griseus _______20Figure 11: The general structure <strong>of</strong> β-lactams ____________________________21Figure 12: β-lactam biosynthetic gene cluster _____________________________23Figure 13: Illustration depict<strong>in</strong>g the key enzymatic reactions <strong>in</strong> the β-lactambiosynthetic pathway _______________________________________23Figure 14: Diagram depict<strong>in</strong>g the regulatory network <strong>in</strong> response to a stimulus<strong>and</strong> the changes accompany<strong>in</strong>g a cells activities <strong>and</strong> functions ______25Figure 15: Clon<strong>in</strong>g soil DNA for isolat<strong>in</strong>g new biosynthetic pathways for thesynthesis <strong>of</strong> bioactive molecules from noncultured soilmicroorganisms ___________________________________________36Figure 16: The <strong>in</strong>fluence <strong>of</strong> temperatures permitt<strong>in</strong>g vegetative growth onsecondary metabolism ______________________________________43Figure 17: Flow chart depict<strong>in</strong>g the strategy employed for select<strong>in</strong>g <strong>and</strong>validat<strong>in</strong>g appropriate primer sequences ________________________54Figure 18: Schematic flow diagram <strong>of</strong> the isolation <strong>of</strong> microbial bioactivesecondary metabolites ______________________________________62Figure 19: Illustration depict<strong>in</strong>g the conserved m<strong>in</strong>imal PKS gene organization<strong>in</strong> Type II PKS ____________________________________________71Figure 20: Comparison <strong>of</strong> the am<strong>in</strong>o acid sequences <strong>of</strong> KSα genes ____________73Figure 21: Comparison <strong>of</strong> the nucleic acid sequences <strong>of</strong> KSα genes ___________75Figure 22: PCR amplification <strong>of</strong> 0.47 kb KSα <strong>in</strong>ternal fragment by PCR fromenvironmental act<strong>in</strong>obacterial isolates__________________________78Figure 23: Multiple sequence alignment <strong>of</strong> β-Ketoacyl synthase (KSα) genesfrom type II PKS <strong>of</strong> spore antibiotic produc<strong>in</strong>g act<strong>in</strong>obacteria withamplified environmental KSα genes from act<strong>in</strong>obacterial isolatesA1488 <strong>and</strong> A3023 _________________________________________79Figure 24: Unrooted neighbour-jo<strong>in</strong><strong>in</strong>g phylogenetic tree constructed from am<strong>in</strong>oacid sequences <strong>of</strong> KSα gene fragments from type II polyketidesynthases ________________________________________________81_____________________________________________________________________v


