Detection and Expression of Biosynthetic Genes in Actinobacteria ...
Detection and Expression of Biosynthetic Genes in Actinobacteria ...
Detection and Expression of Biosynthetic Genes in Actinobacteria ...

You also want an ePaper? Increase the reach of your titles
YUMPU automatically turns print PDFs into web optimized ePapers that Google loves.
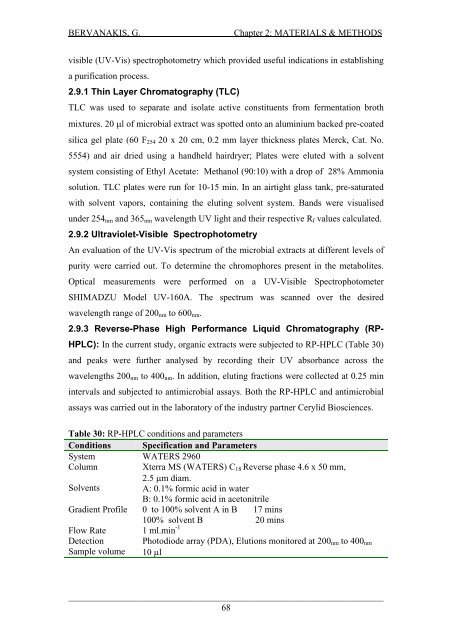
BERVANAKIS, G.Chapter 2: MATERIALS & METHODSvisible (UV-Vis) spectrophotometry which provided useful <strong>in</strong>dications <strong>in</strong> establish<strong>in</strong>ga purification process.2.9.1 Th<strong>in</strong> Layer Chromatography (TLC)TLC was used to separate <strong>and</strong> isolate active constituents from fermentation brothmixtures. 20 μl <strong>of</strong> microbial extract was spotted onto an alum<strong>in</strong>ium backed pre-coatedsilica gel plate (60 F 254 20 x 20 cm, 0.2 mm layer thickness plates Merck, Cat. No.5554) <strong>and</strong> air dried us<strong>in</strong>g a h<strong>and</strong>held hairdryer; Plates were eluted with a solventsystem consist<strong>in</strong>g <strong>of</strong> Ethyl Acetate: Methanol (90:10) with a drop <strong>of</strong> 28% Ammoniasolution. TLC plates were run for 10-15 m<strong>in</strong>. In an airtight glass tank, pre-saturatedwith solvent vapors, conta<strong>in</strong><strong>in</strong>g the elut<strong>in</strong>g solvent system. B<strong>and</strong>s were visualisedunder 254 nm <strong>and</strong> 365 nm wavelength UV light <strong>and</strong> their respective R f values calculated.2.9.2 Ultraviolet-Visible SpectrophotometryAn evaluation <strong>of</strong> the UV-Vis spectrum <strong>of</strong> the microbial extracts at different levels <strong>of</strong>purity were carried out. To determ<strong>in</strong>e the chromophores present <strong>in</strong> the metabolites.Optical measurements were performed on a UV-Visible SpectrophotometerSHIMADZU Model UV-160A. The spectrum was scanned over the desiredwavelength range <strong>of</strong> 200 nm to 600 nm .2.9.3 Reverse-Phase High Performance Liquid Chromatography (RP-HPLC): In the current study, organic extracts were subjected to RP-HPLC (Table 30)<strong>and</strong> peaks were further analysed by record<strong>in</strong>g their UV absorbance across thewavelengths 200 nm to 400 nm . In addition, elut<strong>in</strong>g fractions were collected at 0.25 m<strong>in</strong><strong>in</strong>tervals <strong>and</strong> subjected to antimicrobial assays. Both the RP-HPLC <strong>and</strong> antimicrobialassays was carried out <strong>in</strong> the laboratory <strong>of</strong> the <strong>in</strong>dustry partner Cerylid Biosciences.Table 30: RP-HPLC conditions <strong>and</strong> parametersConditions Specification <strong>and</strong> ParametersSystemColumnWATERS 2960Xterra MS (WATERS) C 18 Reverse phase 4.6 x 50 mm,2.5 μm diam.Solvents A: 0.1% formic acid <strong>in</strong> waterB: 0.1% formic acid <strong>in</strong> acetonitrileGradient Pr<strong>of</strong>ile 0 to 100% solvent A <strong>in</strong> B 17 m<strong>in</strong>sFlow Rate<strong>Detection</strong>Sample volume100% solvent B 20 m<strong>in</strong>s1 ml.m<strong>in</strong> -1Photodiode array (PDA), Elutions monitored at 200 nm to 400 nm10 μl___________________________________________________________________________________68