Flora of Ashdown Forest - Botanical Society of the British Isles
Flora of Ashdown Forest - Botanical Society of the British Isles
Flora of Ashdown Forest - Botanical Society of the British Isles

Create successful ePaper yourself
Turn your PDF publications into a flip-book with our unique Google optimized e-Paper software.
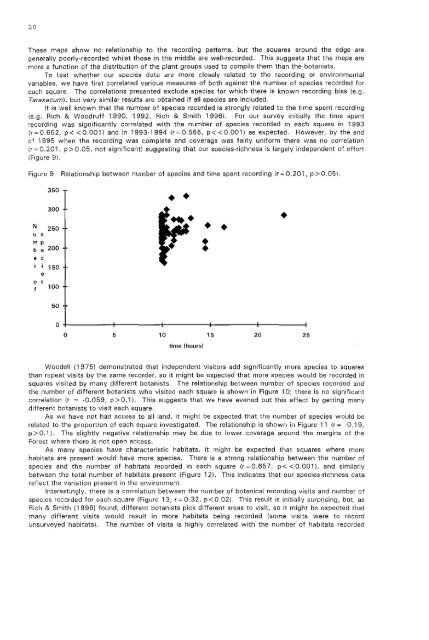
20These maps show no relationship to <strong>the</strong> recording patterns, but <strong>the</strong> squares around <strong>the</strong> edge aregenerally poorly-recorded whilst those in <strong>the</strong> middle are well-recorded. This suggests that <strong>the</strong> maps aremore a function <strong>of</strong> <strong>the</strong> distribution <strong>of</strong> <strong>the</strong> plant groups used to compile <strong>the</strong>m than <strong>the</strong> botanists.To test whe<strong>the</strong>r our species data are more closely related to <strong>the</strong> recording or environmentalvariables, we have first correlated various measures <strong>of</strong> both against <strong>the</strong> number <strong>of</strong> species recorded foreach square. The correlations presented exclude species for which <strong>the</strong>re is known recording bias (e,g.Taraxacum), but very similar results are obtained if all species are included.It is well known that <strong>the</strong> number <strong>of</strong> species recorded is strongly related to <strong>the</strong> time spent recording(e.g. Rich & Woodruff 1990, 1992, Rich & Smith 19961. For our survey initially <strong>the</strong> time spentrecording was significantly correlated with <strong>the</strong> number <strong>of</strong> species recorded in each square in 1993(r~0.652, p«O.OOll and in 1993-1994 (r~0.555, p«O.OOll as expected. However, by <strong>the</strong> end<strong>of</strong> 1995 when <strong>the</strong> recording was complete and coverage was fairly uniform <strong>the</strong>re was no correlation(r = 0.201, p> 0.05, not significant) suggesting that our species-richness is largely independent <strong>of</strong> effort(Figure 91.Figure 9. Relationship between number <strong>of</strong> species and time spent recording (r=0.201, p>0.05).350300• •N 250• •u sm pb e 200 :e cr i 150eo s 100•5000 5 10 15 20 25time (hours)Woodell (1975) demonstrated that independent visitors add significantly more species to squaresthan repeat visits by <strong>the</strong> same recorder, so it might be expected that more species would be recorded insquares visited by many different botanists. The relationship between number <strong>of</strong> species recorded and<strong>the</strong> number <strong>of</strong> different botanists who visited each square is shown in Figure 10; <strong>the</strong>re is no significantcorrelation (r = -0.059, p>O.l). This suggests that we have evened out this effect by getting manydifferent botanists to visit each square.As we have not had access to all land, it might be expected that <strong>the</strong> number <strong>of</strong> species would berelated to <strong>the</strong> proportion <strong>of</strong> each square investigated. The relationship is shown in Figure 11 (r= -0.19,p > 0. 1). The slightly negative relationship may be due to lower coverage around <strong>the</strong> margins <strong>of</strong> <strong>the</strong><strong>Forest</strong> where <strong>the</strong>re is not open access.As many species have characteristic habitats, it might be expected that squares where morehabitats are present would have more species. There is a strong relationship between <strong>the</strong> number <strong>of</strong>species and <strong>the</strong> number <strong>of</strong> habitats recorded in each square (r=0.657, p<