th - 1988 - 51st ENC Conference
th - 1988 - 51st ENC Conference
th - 1988 - 51st ENC Conference

You also want an ePaper? Increase the reach of your titles
YUMPU automatically turns print PDFs into web optimized ePapers that Google loves.
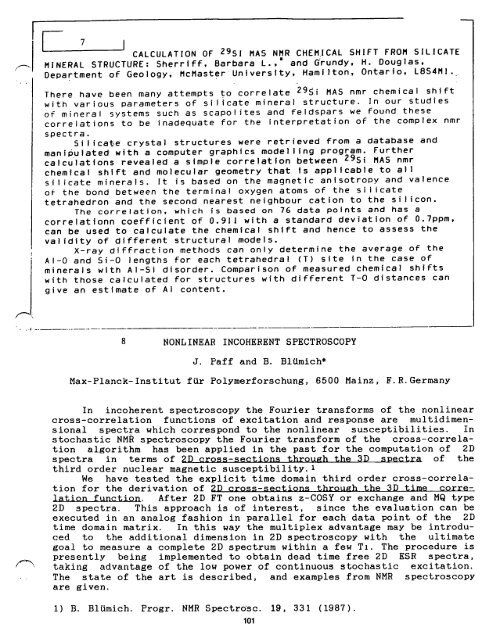
CALCULATION OF 2951MAS NMR CHEMICAL SHIFT FROM SILICATE<br />
MINERAL STRUCTURE: Sherriff, Barbara L. " and G:rundy H Douglas<br />
Department of Geology, McMasterUniversity, Hamilton, Ontario, L8S4MI...<br />
There have been many attempts to correlate 295i MAS nmr chemical shift<br />
wi<strong>th</strong> various parameters of silicate mineral structure. In our studies<br />
of mineral systems such as scapolites and Feldspars we Found <strong>th</strong>ese<br />
correlations to be inadequate For <strong>th</strong>e interpretation of <strong>th</strong>e complex nmr<br />
spectra.<br />
Silicate crystal structures were retrieved from a database and<br />
manipulated wi<strong>th</strong> a computer graphics modelling program• Fur<strong>th</strong>er<br />
calculations revealed a simple correlation between 29Si MAS nmr<br />
chemical shift and molecular geometry <strong>th</strong>at Is applicable to all<br />
silicate minerals. It is based on <strong>th</strong>e magnetic anisotropy and valence<br />
of <strong>th</strong>e bond between <strong>th</strong>e terminal oxygen atoms of <strong>th</strong>e silicate<br />
tetrahedron and <strong>th</strong>e second nearest neighbour cation to <strong>th</strong>e silicon.<br />
The correlation, which is based on 76 data points and has a<br />
correlationn coefficient of 0.911 wi<strong>th</strong> a standard deviation of 0.7ppm,<br />
can be used to calculate <strong>th</strong>e chemical shift and hence to assess <strong>th</strong>e<br />
validity of different structural models.<br />
X-ray diffraction me<strong>th</strong>ods can only determine <strong>th</strong>e average of <strong>th</strong>e<br />
AI-O and Si-O leng<strong>th</strong>s for each tetrahedral (T) site in <strong>th</strong>e case of<br />
minerals wi<strong>th</strong> AI-Si disorder. Comparison of measured chemical shifts<br />
wi<strong>th</strong> <strong>th</strong>ose calculated For structures wi<strong>th</strong> different T-O distances can<br />
give an estimate of AI content.<br />
8 NONLINEAR INCOHERENT SPECTROSCOPY<br />
J. Paff and B. BiOmich*<br />
Max-Planck-Institut fur Polymerforschung, 6500 Mainz, F.R. Germany<br />
In incoherent spectroscopy <strong>th</strong>e Fourier transforms of <strong>th</strong>e nonlinear<br />
cross-correlation functions of excitation and response are multidimen-<br />
sional spectra which correspond to <strong>th</strong>e nonlinear susceptibilities. In<br />
stochastic NMR spectroscopy <strong>th</strong>e Fourier transform of <strong>th</strong>e cross-correla-<br />
tion algori<strong>th</strong>m has been applied in <strong>th</strong>e past for <strong>th</strong>e computation of 2D<br />
spectra in terms of 2D cross-sections <strong>th</strong>rough <strong>th</strong>e 3D spectra of <strong>th</strong>e<br />
<strong>th</strong>ird order nuclear magnetic susceptibility. 1<br />
We have tested <strong>th</strong>e explicit time domain <strong>th</strong>ird order cross-correla-<br />
tion for <strong>th</strong>e derivation of 2D cross-sections <strong>th</strong>rough <strong>th</strong>e 3D time corre-<br />
lation function. After 2D FT one obtains z-COSY or exchange and MQ type<br />
2D spectra. This approach is of interest, since <strong>th</strong>e evaluation can be<br />
executed in an analog fashion in parallel for each data point of <strong>th</strong>e 2D<br />
time domain matrix. In <strong>th</strong>is way <strong>th</strong>e multiplex advantage may be introdu-<br />
ced to <strong>th</strong>e additional dimension in 2D spectroscopy wi<strong>th</strong> <strong>th</strong>e ultimate<br />
goal to measure a complete 2D spectrum wi<strong>th</strong>in a few TI. The procedure is<br />
presently being implemented to obtain dead time free 2D ESR spectra,<br />
taking advantage of <strong>th</strong>e low power of continuous stochastic excitation.<br />
The state of <strong>th</strong>e art is described, and examples from NMR spectroscopy<br />
are given.<br />
i) B. BiOmich. Progr. NMR Spectrosc. 19, 331 (1987).<br />
101