- Page 1 and 2: 29 th ���� - 1988 Rochester
- Page 3 and 4: PROGRAM: This conference program ha
- Page 5 and 6: The Executive Committee of the 29th
- Page 7 and 8: A A 0 0 ,-..1 I Z Z 0 "c N "1" i 0
- Page 9 and 10: Restaurants in Rochester Restaurant
- Page 11 and 12: 8:30 a.m. 8:35- 10:05 10:05 - 10:25
- Page 13 and 14: 8:30 a.m. 8:35 a.m. 9:05 a.m. 9:15
- Page 15 and 16: f~ I UNTRUNCATIO~I OF DIPOLE-DIPOLE
- Page 17 and 18: MON 9:25 HIGH RESOLUTION ELECTROPHO
- Page 19 and 20: • . r, 10:25 a.m. 10:55 a.m. 11:0
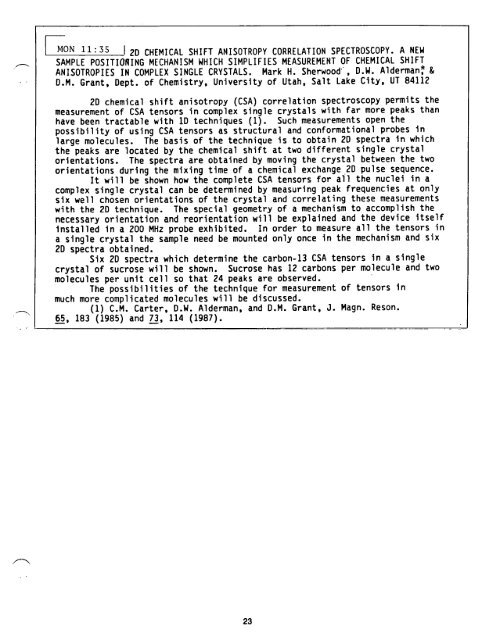
- Page 21: ~'-O-i 0 N i0:55 MEASUREMENTS OF TW
- Page 25 and 26: 7:30 p.m. 8:00 p.m. 8:10 p.m. 8:40
- Page 27 and 28: HON Eve 8:00 The 13C Relaxation Beh
- Page 29 and 30: THE WORLD AND WONDERS OF 3H NMR SPE
- Page 31 and 32: 8:30 a.m. 9:00 a.m. 9:10 a.m. 9:20
- Page 33 and 34: TWO DIMENSIONAL LINEAR PREDICTION N
- Page 35 and 36: TUE 9"20 ] 2D ROTATING FRAME SPECTR
- Page 37 and 38: 10:40 a.m. 11:00 a.m. 11:20 a.m. 11
- Page 39 and 40: TUE ii'00 J WATER SUPPRESSION TECHN
- Page 41 and 42: TUE 11:30 J FREQUENCY SWITCHED INVE
- Page 43 and 44: 7:30 p.m. 8:00 p.m. 8:30 p.m. 8:50
- Page 45 and 46: • . r T[-~-UE ~ t~ve 8:00! 63,65C
- Page 47 and 48: TUE Eve 8-50 } Cu NQR OF YBa2Cu30 x
- Page 49 and 50: ~X [I'IED 8:30 I REMOVAL OF EXTRANE
- Page 51 and 52: . r WED 9:25 ] A STATIC NMR IMAGE O
- Page 53 and 54: WED 9" 45 IFLUID AND SOLID STATE NM
- Page 55 and 56: i MULTIVOLUME SELECTIVE SPECTROSCOP
- Page 57 and 58: [WED 11-10 I SELF SHIELDED GRADIENT
- Page 59 and 60: [WED 11:45 ] ANGIOGRAPHY USING MAGN
- Page 61 and 62: THU 8:30 "TETHERED" BIOLOGICAL SYST
- Page 63 and 64: • / I DYNAMICS OF THE GRAMICIDIN
- Page 65 and 66: I THU 9:40 I NMR STUDIES OF ANTI-SP
- Page 67 and 68: THU 10"2S I NEW TECHNIQUES POR DYNA
- Page 69 and 70: I THU 11 : 05 I DYNAMIC NUCLEAR POL
- Page 71 and 72: THIS SECTION CONTAINS A LISTING OF
- Page 73 and 74:
9 ELIMINATION OF PHASE ROLL, SOLVEN
- Page 75 and 76:
25 NUCLEAR MAGNETIC RESONANCE STUDI
- Page 77 and 78:
~k 41 A HYPO-RELAXATION AGENT; SIMU
- Page 79 and 80:
57 STRUCTURAL STUDIES OF LIPIDS IN
- Page 81 and 82:
73 THE AUTOMATED NMR LABORATORY; SP
- Page 83 and 84:
89 13C NMR ASSIGNMENTS OF DNA OLIGO
- Page 85 and 86:
105 EVALUATION OF DOUBLE TUNED CIRC
- Page 87 and 88:
121 BROADBAND SPIN DECOUPLING IN TH
- Page 89 and 90:
137 TWO-DIMENSIONAL 13C{15N}, 13C{1
- Page 91 and 92:
153 NMR CHARACTERIZATION OF THE SOL
- Page 93 and 94:
169 SPECTROSCOPY WITH EXACT APODIZA
- Page 95 and 96:
185 PARSING THE EDITED 1H NMR SIGNA
- Page 97 and 98:
. z 201 THE CORRELATION OF 1H-19F C
- Page 99 and 100:
i m 3 I 31p SOLID STATE NMR STUDIES
- Page 101 and 102:
CALCULATION OF 2951MAS NMR CHEMICAL
- Page 103 and 104:
AN NMR STUDY OF MISCIBLE BLENDS IN
- Page 105 and 106:
15 II9F CRAMPS OF INORGANIC FLUORID
- Page 107 and 108:
19 I DIPOLARAND SPIN-ROTATION POLAR
- Page 109 and 110:
2 3- I A SOLID-STATE 2H and 13C NMR
- Page 111 and 112:
27 1 COLLECTION OF PHOSPHORUS-31 NM
- Page 113 and 114:
31 DELAYED REFOCUSSING TWO-DIMENSIO
- Page 115 and 116:
35 DYNAMIC NUCLEAR POLARIZATION STU
- Page 117 and 118:
I 39 2D NMR STUDIES AT 600 MHZ OF A
- Page 119 and 120:
43 Coherent Averaging Theory Under
- Page 121 and 122:
46 CARBON-13 SPECTRAL ASSIGNMENTS O
- Page 123 and 124:
a b 48 SEMUT SPECTRAL EDITING, CALI
- Page 125 and 126:
'--- V 5 2 j INTERCONWERSION OF VAL
- Page 127 and 128:
[ ~ THE SOURCE OF AN ARTIFACT IN TH
- Page 129 and 130:
60 GLUCOSE METABOLISM IN PERFUSED H
- Page 131 and 132:
. °- F 64 I MICROSCOPIC IMAGING OF
- Page 133 and 134:
68 69 CONFORMATIONAL ANALYSIS via V
- Page 135 and 136:
72 I SCUBA, A MAY TOHARDS COMPLETE
- Page 137 and 138:
76 NMR CHARACTERIZATION OF THE GLYP
- Page 139 and 140:
8o I HIGH RESOLUTION MR IMAGING AT
- Page 141 and 142:
A PROBE WITH HIGHER DECOUPLING EFFI
- Page 143 and 144:
88 I SOLID STATE ll3cd I~CLEAR }~GE
- Page 145 and 146:
- - 92 l CHARACTERIZATION OF NORMAL
- Page 147 and 148:
96 AN EVALUATION OF NEW PROCESSING
- Page 149 and 150:
. . I00 I NOVEL RESONATOR DESIGNS,
- Page 151 and 152:
104 TAYLOR TRANSFORMATION OF 2D NMR
- Page 153 and 154:
108 PERFORMANCE COMPARISON OF DOUBL
- Page 155 and 156:
RECENT EXTENSIONS OF NOESYSIM, A PR
- Page 157 and 158:
116 ] NODIFICATIONS TO A JEOL GX270
- Page 159 and 160:
I 12 o I SPECIATION OF WATER IN GLA
- Page 161 and 162:
124 I A COMPLETELY INTEGRATED NETWO
- Page 163 and 164:
I-- 1 2 8 IVOLUME-SELECTIVE SIGNAL
- Page 165 and 166:
-- is 2 I NATURAL ABUNDANCE 13 C an
- Page 167 and 168:
. ° THREE-DIMENSIONAL STRUCTURE OF
- Page 169 and 170:
~-'-- 140 DIRECT OBSERVATION OF LON
- Page 171 and 172:
144 I I IH AND 13C REFOCUSED GRADIE
- Page 173 and 174:
~ (POSTER ABSTRACT) BARBARA LYONS/C
- Page 175 and 176:
1 52 I ~IR STUDY OF NAPHTHALENE TRA
- Page 177 and 178:
is6 I ROTATING FRAME COHERENCE TRAN
- Page 179 and 180:
16 0 I A 27AL MAS STUDY OF AMORPHOU
- Page 181 and 182:
164 I MODIFICATIOH OF A BRUKER WH-3
- Page 183 and 184:
IN VIVO 31p AND IH NMR SPECTROSCOPY
- Page 185 and 186:
. r 172 JMAGIC ANGLE SPINNING SEPAR
- Page 187 and 188:
2 . ° I- 176 I Michael A. Kennedy
- Page 189 and 190:
. o . o 180 l17o/Is NMR MICROSCOPY
- Page 191 and 192:
To be presented at the 29th Experim
- Page 193 and 194:
INHIBITION OF ALANINE RACEMASE BY T
- Page 195 and 196:
192 RESOLUTION ENHANCEMENT OF PHOSP
- Page 197 and 198:
196 1 TR FLUOROETHOXY DERIVATIVES:
- Page 199 and 200:
200 INTERPRETAT IION OF 13 C NHR MI
- Page 201 and 202:
204 RECENT PROGRESS IN HIGH RESOLUT
- Page 203 and 204:
Page No. ACEVEDO, H F 165 ACKERMAN,
- Page 205 and 206:
1:~ge No. GUO, D 200 GUO, W 196 GUO
- Page 207 and 208:
OPELLA, S J ORENDT, A M OTTING, G P
- Page 209 and 210:
ZLOTNIK-MAZORIo T ZUMBULYADIS, N Pa
- Page 211 and 212:
David B. Bailey USI Chemicals Co. 1
- Page 213 and 214:
Yvan Boulanger Univ de Montreal Ins
- Page 215 and 216:
Helga Cohen Univ of So Carolina Che
- Page 217 and 218:
F. David Doty Doty Scientific Inc.
- Page 219 and 220:
Alan Freyer Pennsylvania State Univ
- Page 221 and 222:
Gordon Hamer Xerox Research Center-
- Page 223 and 224:
Timothy Hyman Syracuse University 3
- Page 225 and 226:
Robert A Kinsey BF Goodrich 9921Bre
- Page 227 and 228:
Jay J. Listinsky U of Rochester-Dep
- Page 229 and 230:
Dale Mierke Univ of Calif, San Dieg
- Page 231 and 232:
Jeanne C Owens Chemistry Dept., '.1
- Page 233 and 234:
Gade S. Reddy DuPont Experimental S
- Page 235 and 236:
Charles Schramm Catalytica Assoc. I
- Page 237 and 238:
Richard F. Sprecher U.S. Dept of En
- Page 239 and 240:
Steve Unger U. C. Davis NMR Facilit
- Page 241:
Toni Wirthlin Varian Associates 611