th - 1988 - 51st ENC Conference
th - 1988 - 51st ENC Conference
th - 1988 - 51st ENC Conference

Create successful ePaper yourself
Turn your PDF publications into a flip-book with our unique Google optimized e-Paper software.
1 1 0<br />
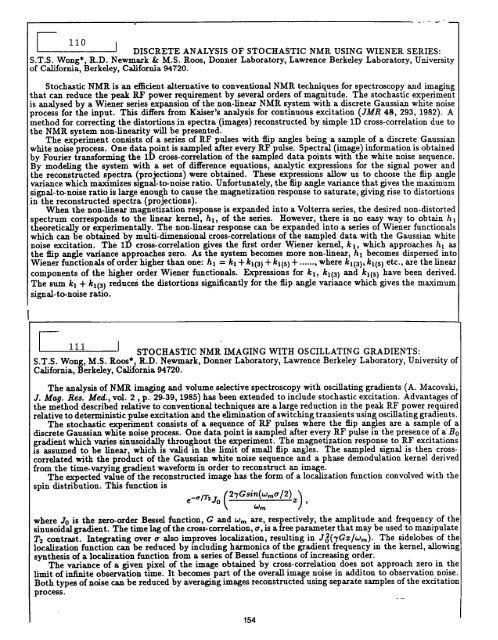
-- [ DISCRETE ANALYSIS OF STOCHASTIC NMR USING WIENER SERIES:<br />
S.T.S. Wong*, R.D. Newmark & M.S. Roos, Donner Laboratory, Lawrence Berkeley Laboratory, University<br />
of California, Berkeley, California 94720.<br />
Stochastic NMR is an efficient alternative to conventional NMR techniques for spectroscopy and imaging<br />
<strong>th</strong>at can reduce <strong>th</strong>e peak RF power requirement by several orders of magnitude. The stochastic experiment<br />
is analysed by a Wiener series expansion of <strong>th</strong>e non-linear NMR system wi<strong>th</strong> a discrete Gaussian white noise<br />
process for <strong>th</strong>e input. This diifers from Kaiser's analysis for continuous excitation (JMR 48, 293, 1982). A<br />
me<strong>th</strong>od for correcting <strong>th</strong>e distortions in spectra (images) reconstructed by simple 1D cross-correlation due to<br />
<strong>th</strong>e NMR system non-linearity will be presented.<br />
The experiment consists of a series of RF pulses wi<strong>th</strong> Rip angles being a sample of a discrete Gaussian<br />
white noise process. One data point is sampled after every RF pulse. Spectral (image) information is obtained<br />
by Fourier transforming <strong>th</strong>e 1D cross-correlation of <strong>th</strong>e sampled data points wi<strong>th</strong> <strong>th</strong>e white noise sequence.<br />
By modeling <strong>th</strong>e system wi<strong>th</strong> a set of difference equations, analytic expressions for <strong>th</strong>e signal power and<br />
<strong>th</strong>e reconstructed spectra (projections) were obtained. These expressions allow us to choose <strong>th</strong>e Rip angle<br />
variance which maximizes signal-to-noise ratio. Unfortunately, <strong>th</strong>e Rip angle variance <strong>th</strong>at gives <strong>th</strong>e maximum<br />
signal-to-noise ratio is large enough to cause <strong>th</strong>e magnetization response to saturate, giving rise to distortions<br />
in <strong>th</strong>e reconstructed spectra (projections).<br />
When <strong>th</strong>e non-linear magnetization response is expanded into a Volterra series, <strong>th</strong>e desired non-distorted<br />
spectrum corresponds to <strong>th</strong>e linear kernel, hl, of <strong>th</strong>e series. However, <strong>th</strong>ere is no easy way to obtain hl<br />
<strong>th</strong>eoretically or experimentally. The non-linear response cam be expanded into a series of Wiener functionals<br />
which can be obtained by multi-dimensional cross-correlations of <strong>th</strong>e sampled data wi<strong>th</strong> <strong>th</strong>e Gaussian white<br />
noise excitation. The 1D cross-correlation gives <strong>th</strong>e first order Wiener kernel, kl, which approaches hl as<br />
<strong>th</strong>e Rip angle variance approaches zero. As <strong>th</strong>e system becomes more non-linear, hl becomes dispersed into<br />
Wiener functionals of order higher <strong>th</strong>an one: hl = kl + ki(3) + k1(s) + ...... , where k](3), k1(s) etc., are <strong>th</strong>e linear<br />
components of <strong>th</strong>e higher order Wiener functionals. Expressions for kl, ki(3) and k1(s) have been derived.<br />
The sum/=i + ki(3) reduces <strong>th</strong>e distortions significantly for <strong>th</strong>e Rip angle variance which gives <strong>th</strong>e maximum<br />
signal-to-noise ratio.<br />
11 1 J STOCHASTIC NMR IMAGING WITH OSCILLATING GRADIENTS:<br />
S.T.S. Wong, M.S. Roos*, R.D. Newmark, Donner Laboratory, Lawrence Berkeley Laboratory, University of<br />
California, Berkeley, California 94720.<br />
The analysis of NMR imaging and volume selective spectroscopy wi<strong>th</strong> oscillating gradients (A. Macovski,<br />
J. Mag. Res. Med., vol. 2, p. 29-39, 1985) has been extended to include stochastic excitation. Advantages of<br />
<strong>th</strong>e me<strong>th</strong>od described relative to conventional techniques are a large reduction in <strong>th</strong>e peak RF power required<br />
relative to deterministic pulse excitation and <strong>th</strong>e elimination of switching transients using oscillating gradients.<br />
The stochastic experiment consists of a sequence of RF pulses where <strong>th</strong>e Rip angles are a sample of a<br />
discrete Gaussian white noise process. One data point is sampled after every RF pulse in <strong>th</strong>e presence of a B0<br />
gradient which varies sinusoidally <strong>th</strong>roughout <strong>th</strong>e experiment. The magnetization response to RF excitations<br />
is assumed to be linear, which is valid in <strong>th</strong>e limit of small Rip angles. The sampled signal is <strong>th</strong>en cross-<br />
correlated wi<strong>th</strong> <strong>th</strong>e product of <strong>th</strong>e Gaussian white noise sequence and a phase demodulation kernel derived<br />
from <strong>th</strong>e time-varying gradient waveform in order to reconstruct an image.<br />
The expected value of <strong>th</strong>e reconstructed image has <strong>th</strong>e form of a localization function convolved wi<strong>th</strong> <strong>th</strong>e<br />
spin distribution. This function is<br />
e -°/T' 3o (2~Gsin(WmO'/2) z~,<br />
\ Wm /<br />
where 3o is <strong>th</strong>e zero-order Bessel function, G and co. are, respectively, <strong>th</strong>e amplitude and frequency of <strong>th</strong>e<br />
siausoidal gradient. The time lag of <strong>th</strong>e cross-correlation, o, is a free parameter <strong>th</strong>at may be used to manipulate<br />
T2 contrast. Integrating over o also improves localization, resulting in Jo(TGz/a~,n). The sidelobes of <strong>th</strong>e<br />
localization function can be reduced by including harmonics of <strong>th</strong>e gradient frequency in <strong>th</strong>e kernel, allowing<br />
syn<strong>th</strong>esis of a localization function from a series of Bessel functions of increasing order.<br />
The variance of a given pixel of <strong>th</strong>e image obtained by cross-correlation does not approach zero in <strong>th</strong>e<br />
limit of infLnite observation time. It becomes part of <strong>th</strong>e overall image noise in additon to observation noise.<br />
Bo<strong>th</strong> types of noise can be reduced by averaging images reconstructed using separate samples of <strong>th</strong>e excitation<br />
process.<br />
154<br />
. - -