th - 1988 - 51st ENC Conference
th - 1988 - 51st ENC Conference
th - 1988 - 51st ENC Conference

You also want an ePaper? Increase the reach of your titles
YUMPU automatically turns print PDFs into web optimized ePapers that Google loves.
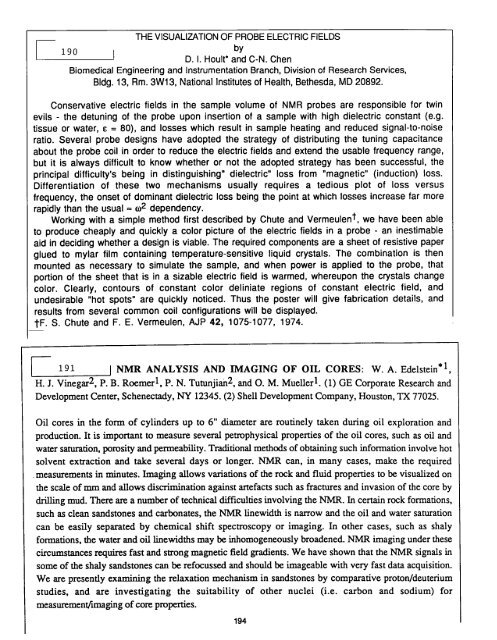
THE VISUALIZATION OF PROBE ELECTRIC FIELDS<br />
by<br />
190 j D.I. Hoult* and C-N. Chen<br />
Biomedical Engineering and Instrumentation Branch, Division of Research Services,<br />
Bldg. 13, Rm. 3W13, National Institutes of Heal<strong>th</strong>, Be<strong>th</strong>esda, MD 20892.<br />
Conservative electric fields in <strong>th</strong>e sample volume of NMR probes are responsible for twin<br />
evils - <strong>th</strong>e detuning of <strong>th</strong>e probe upon insertion of a sample wi<strong>th</strong> high dielectric constant (e.g.<br />
tissue or water, E = 80), and losses which result in sample heating and reduced signal-to-noise<br />
ratio. Several probe designs have adopted <strong>th</strong>e strategy of distributing <strong>th</strong>e tuning capacitance<br />
about <strong>th</strong>e probe coil in order to reduce <strong>th</strong>e electric fields and extend <strong>th</strong>e usable frequency range,<br />
but it is always difficult to know whe<strong>th</strong>er or not <strong>th</strong>e adopted strategy has been successful, <strong>th</strong>e<br />
principal difficulty's being in distinguishing" dielectric" loss from "magnetic" (induction) loss.<br />
Differentiation of <strong>th</strong>ese two mechanisms usually requires a tedious plot of loss versus<br />
frequency, <strong>th</strong>e onset of dominant dielectric loss being <strong>th</strong>e point at which losses increase far more<br />
rapidly <strong>th</strong>an <strong>th</strong>e usual = (02 dependency.<br />
Working wi<strong>th</strong> a simple me<strong>th</strong>od first described by Chute and Vermeulen t, we have been able<br />
to produce cheaply and quickly a color picture of <strong>th</strong>e electric fields in a probe - an inestimable<br />
aid in deciding whe<strong>th</strong>er a design is viable. The required components are a sheet of resistive paper<br />
glued to mylar film containing temperature-sensitive liquid crystals. The combination is <strong>th</strong>en<br />
mounted as necessary to simulate <strong>th</strong>e sample, and when power is applied to <strong>th</strong>e probe, <strong>th</strong>at<br />
portion of <strong>th</strong>e sheet <strong>th</strong>at is in a sizable electric field is warmed, whereupon <strong>th</strong>e crystals change<br />
color. Clearly, contours of constant color deliniate regions of constant electric field, and<br />
undesirable "hot spots" are quickly noticed. Thus <strong>th</strong>e poster will give fabrication details, and<br />
results from several common coil configurations will be displayed.<br />
IF. S. Chute and F. E. Vermeulen, AJP 42, 1075-1077, 1974.<br />
191 ] NMR ANALYSIS AND IMAGING OF OIL CORES: W. A. Edelstein .1,<br />
H. J. Vinegar 2, P. B. Roemer 1, P. N. Tutunjian 2, and O. M. Mueller 1. (1) GE Corporate Research and<br />
Development Center, Schenectady, NY 12345. (2) Shell Development Company, Houston, TX 77025.<br />
Oil cores in <strong>th</strong>e form of cylinders up to 6" diameter are routinely taken during oil exploration and<br />
production. It is important to measure several petrophysical properties of <strong>th</strong>e oil cores, such as oil and<br />
water saturation, porosity and permeability. Traditional me<strong>th</strong>ods of obtaining such information involve hot<br />
solvent extraction and take several days or longer. NMR can, in many cases, make <strong>th</strong>e required<br />
measurements in minutes. Imaging allows variations of <strong>th</strong>e rock and fluid properties to be visualized on<br />
<strong>th</strong>e scale of mm and allows discrimination against artefacts such as fractures and invasion of <strong>th</strong>e core by<br />
drilling mud. There are a number of technical difficulties involving <strong>th</strong>e NMR. In certain rock formations,<br />
such as clean sandstones and carbonates, <strong>th</strong>e NMR linewid<strong>th</strong> is narrow and <strong>th</strong>e oil and water saturation<br />
can be easily separated by chemical shift spectroscopy or imaging. In o<strong>th</strong>er cases, such as shaly<br />
formations, <strong>th</strong>e water and oil linewid<strong>th</strong>s may be inhomogeneously broadened. NMR imaging under <strong>th</strong>ese<br />
circumstances requires fast and strong magnetic field gradients. We have shown <strong>th</strong>at <strong>th</strong>e NMR signals in<br />
some of <strong>th</strong>e shaly sandstones can be refocussed and should be imageable wi<strong>th</strong> very fast data acquisition.<br />
We are presently examining <strong>th</strong>e relaxation mechanism in sandstones by comparative proton/deuterium<br />
studies, and are investigating <strong>th</strong>e suitability of o<strong>th</strong>er nuclei (i.e. carbon and sodium) for<br />
measurementftmaging of core properties.<br />
194