th - 1988 - 51st ENC Conference
th - 1988 - 51st ENC Conference
th - 1988 - 51st ENC Conference
You also want an ePaper? Increase the reach of your titles
YUMPU automatically turns print PDFs into web optimized ePapers that Google loves.
- - 92 l<br />
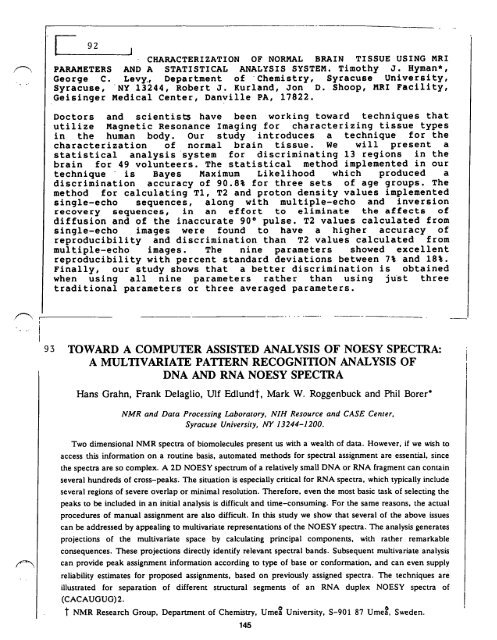
CHARACTERIZATION OF NORMAL BRAIN TISSUE USING MRI<br />
PARAMETERS AND A STATISTICAL ANALYSIS SYSTEM. Timo<strong>th</strong>y J. Hyman*,<br />
George C. Levy, Department of Chemistry, Syracuse University,<br />
Syracuse, NY 13244, Robert J. Kurland, Jon D. Shoop, MRI Facility,<br />
Geisinger Medical Center, Danville PA, 17822.<br />
Doctors and scientis~ have been working toward techniques <strong>th</strong>at<br />
utilize Magnetic Resonance Imaging for characterizing tissue types<br />
in <strong>th</strong>e human body. Our study introduces a technique for <strong>th</strong>e<br />
characterization of normal brain tissue. We will present a<br />
statistical analysissystem for discriminating 13 regions in <strong>th</strong>e<br />
brain for 49 volunteers. The statistical me<strong>th</strong>od implemented in our<br />
technique is Bayes Maximum Likelihood which produced a<br />
discrimination accuracy of 90.8% for <strong>th</strong>ree sets of age groups. The<br />
me<strong>th</strong>od for calculating TI, T2 and proton density values implemented<br />
single-echo sequences, along wi<strong>th</strong> multiple-echo and inversion<br />
recovery sequences, in an effort to eliminate <strong>th</strong>e affects of<br />
diffusion and of <strong>th</strong>e inaccurate 90" pulse. T2 values calculated from<br />
single-echo images were found to have a higher accuracy of<br />
reproducibility and discrimination <strong>th</strong>an T2 values calculated from<br />
multiple-echo images. The nine parameters showed excellent<br />
reproducibility wi<strong>th</strong> percent standard deviations between 7% and 18%.<br />
Finally, our study shows <strong>th</strong>at a better discrimination is obtained<br />
when using all nine parameters ra<strong>th</strong>er <strong>th</strong>an using just <strong>th</strong>ree<br />
traditional parameters or <strong>th</strong>ree averaged parameters.<br />
93 TOWARD A COMPUTER ASSISTED ANALYSIS OF NOESY SPECTRA:<br />
A MULTIVARIATE PATYERN RECOGNITION ANALYSIS OF<br />
DNA AND RNA NOESY SPECTRA<br />
Hans Grahn, Frank Delaglio, Ulf Edlundt, Mark W. Roggenbuck and Phil Borer*<br />
NMR and Data Processing Laboratory, NIH Resource and CASE Center,<br />
Syracuse University, NY 13244-1200.<br />
Two dimensional NMR spectra of biomolecules present us wi<strong>th</strong> a weal<strong>th</strong> of data. However, if we wish to<br />
access <strong>th</strong>is information on a routine basis, automated me<strong>th</strong>ods for spectral assignment are essential, since<br />
<strong>th</strong>e spectra are so complex. A 2D NOESY spectrum of a relatively small DNA or RNA fragment can contain<br />
several hundreds of cross-peaks. The situation is especially critical for RNA spectra, which typically include<br />
several regions of severe overlap or minimal resolution. Therefore, even <strong>th</strong>e most basic task of selecting <strong>th</strong>e<br />
peaks to be included in an initial analysis is difficult and time-consuming. For <strong>th</strong>e same reasons, <strong>th</strong>e actual<br />
procedures of manual assignment are also difficult. In <strong>th</strong>is study we show <strong>th</strong>at several of <strong>th</strong>e above issues<br />
can be addressed by appealing to multivariate representations of <strong>th</strong>e NOESY spectra. The analysis generates<br />
projections of <strong>th</strong>e multivariate space by calculating principal components, wi<strong>th</strong> ra<strong>th</strong>er remarkable<br />
consequences. These projections directly identify relevant spectral bands. Subsequent multivariate analysis<br />
can provide peak assignment information according to type of base or conformation, and can even supply<br />
reliability estimates for proposed assignments, based on previously assigned spectra. The techniques are<br />
illustrated for separation of different structural segments of an RNA duplex NOESY spectra of<br />
(CACAUGUG) 2.<br />
NMR Research Group, Department of Chemistry, Ume~ University, S-901 87 Ume~, Sweden.<br />
14,5


