th - 1988 - 51st ENC Conference
th - 1988 - 51st ENC Conference
th - 1988 - 51st ENC Conference

You also want an ePaper? Increase the reach of your titles
YUMPU automatically turns print PDFs into web optimized ePapers that Google loves.
102<br />
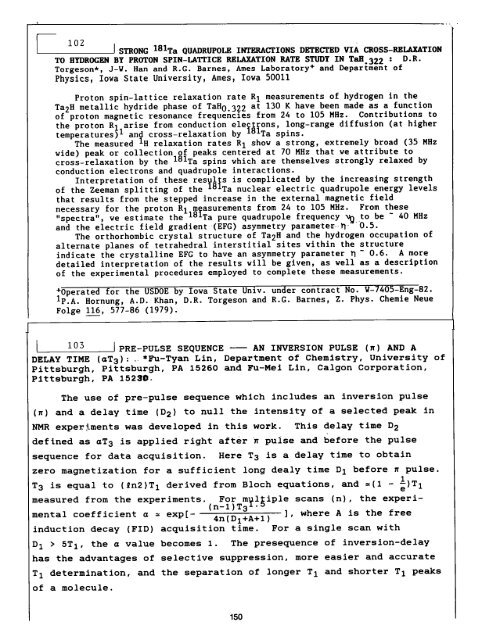
] STRONG 181Ta OUADRUPOLE INTERACTIONS DETECTED VIA CROSS-RELAXATION<br />
TO HYDROGEN BY PROTON SPIN-LATTICE RELAXATION RATE STUDY IN TAB.322 : D.R.<br />
Torgeson*, J-W. Han and R.G. Barnes, Ames Laboratory + and Department of<br />
Physics, Iowa State University, Ames, Iowa 50011<br />
Proton spin-lattice relaxation rate R 1 measurements of hydrogen in <strong>th</strong>e<br />
Ta2H metallic hydride phase of TaH 0 322 at 130 K have been made as a function<br />
of proton magnetic resonance frequencies from 24 to 105 MHz. Contributions to<br />
<strong>th</strong>e proton Rl.arise from conduction elegl[ons, long-range diffusion (at higher<br />
temperatures) i an~ cross-relaxation by ISITa spins.<br />
The measured H relaxation rates R 1 show a strong, extremely broad (35 MHz<br />
wide) peak or collection R~ peaks centered at 70 MHz <strong>th</strong>at we attribute to<br />
cross-relaxation by <strong>th</strong>e 1°iTa spins which are <strong>th</strong>emselves strongly relaxed by<br />
conduction electrons and quadrupole interactions.<br />
Interpretation of <strong>th</strong>ese resplls is complicated by <strong>th</strong>e increasing streng<strong>th</strong><br />
of <strong>th</strong>e Zeeman splitting of <strong>th</strong>e ~SITa nuclear electric quadrupole energy levels<br />
<strong>th</strong>at results from <strong>th</strong>e stepped increase in <strong>th</strong>e external magnetic field<br />
necessary for <strong>th</strong>e proton R 1 measurements from 24 to 105 MHz. From <strong>th</strong>ese<br />
"spectra", we estimate <strong>th</strong>e 181Ta pure quadrupole frequency ~0 to be - 40 MHz<br />
and <strong>th</strong>e electric field gradient (EFG) asymmetry parameter-~-- 0.5.<br />
The or<strong>th</strong>orhombic crystal structure of Ta2H and <strong>th</strong>e hydrogen occupation of<br />
alternate planes of tetrahedral interstitial sites wi<strong>th</strong>in <strong>th</strong>e structure<br />
indicate <strong>th</strong>e crystalline EFG to have an asymmetry parameter ~ ~ 0.6. A more<br />
detailed interpretation of <strong>th</strong>e results will be given, as well as a description<br />
of <strong>th</strong>e experimental procedures employed to complete <strong>th</strong>ese measurements.<br />
+Operated for <strong>th</strong>e USDOE by Iowa State Univ. under contract No. W-7405-Eng-82.<br />
1p.A. Hornung, A.D. Khan, D.R. Torgeson and R.G. Barnes, Z. Phys. Chemie Neue<br />
Folge 116, 577-86 (1979).<br />
i03 I PRE-PULSE SEQU<strong>ENC</strong>E -- AN INVERSION PULSE (~) AND A<br />
DELAY TIME (aT3): . =Fu-Tyan Lin, Department of Chemistry, University of<br />
Pittsburgh, Pittsburgh, PA 15260 and Fu-Mel Lin, Calgon Corporation,<br />
Pittsburgh, PA 152~-<br />
The use of pre-pulse sequence which includes an inversion pulse<br />
(~) and a delay time (D 2) to null <strong>th</strong>e intensity of a selected peak in<br />
NMR experiments was developed in <strong>th</strong>is work. This delay time D 2<br />
defined as aT 3 is applied right after W pulse and before <strong>th</strong>e pulse<br />
sequence for data acquisition. Here T 3 is a delay time to obtain<br />
zero magnetization for a sufficient long dealy time D 1 before ~ pulse.<br />
1<br />
T 3 is equal to (2n2)T 1 derived from Bloch equations, and =(I - ~)T 1<br />
measured from <strong>th</strong>e experiments. For m~l~iple scans (n), <strong>th</strong>e experi-<br />
(n-l)T3 z<br />
mental coefficient a = exp[- 4n(DI+A+I) ], where A is <strong>th</strong>e free<br />
induction decay (FID) acquisition time. For a single scan wi<strong>th</strong><br />
D 1 > 5T I, <strong>th</strong>e a value becomes I. The presequence of inversion-delay<br />
has <strong>th</strong>e advantages of selective suppression, more easier and accurate<br />
T 1 determination, and <strong>th</strong>e separation of longer T 1 and shorter T 1 peaks<br />
of a molecule.<br />
150