th - 1988 - 51st ENC Conference
th - 1988 - 51st ENC Conference
th - 1988 - 51st ENC Conference

Create successful ePaper yourself
Turn your PDF publications into a flip-book with our unique Google optimized e-Paper software.
86 THE USE OF J-SPECTRUM TYPE PULSE SEQU<strong>ENC</strong>ES<br />
IN COUPLED RELAXATION STUDIES<br />
Liu Fang*, Charles L. Mayne, David M. Grant<br />
Department Of Chemistry, University of Utah, Salt Lake City, Utah 84112<br />
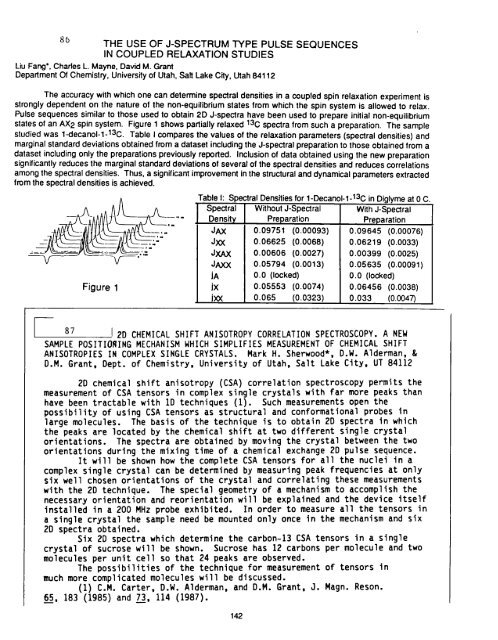
The accuracy wi<strong>th</strong> which one can determine spectral densities in a coupled spin relaxation experiment is<br />
strongly dependent on <strong>th</strong>e nature of <strong>th</strong>e non-equilibrium states from which <strong>th</strong>e spin system is allowed to relax.<br />
Pulse sequences similar to <strong>th</strong>ose used to obtain 2D J-spectra have been used to prepare initial non-equilibrium<br />
states of an AX2 spin system. Figure 1 shows partially relaxed 13C spectra from such a preparation. The sample<br />
studied was 1-decanol-l-13C. Table I compares <strong>th</strong>e values of <strong>th</strong>e relaxation parameters (spectral densities) and<br />
marginal standard deviations obtained from a dataset including <strong>th</strong>e J-spectral preparation to <strong>th</strong>ose obtained from a<br />
dataset including only <strong>th</strong>e preparations previously reported. Inclusion of data obtained using <strong>th</strong>e new preparation<br />
significantly reduces <strong>th</strong>e marginal standard deviations of several of <strong>th</strong>e spectral densities and reduces correlations<br />
among <strong>th</strong>e spectral densities. Thus, a significant improvement in <strong>th</strong>e structural and dynamical parameters extracted<br />
from <strong>th</strong>e spectral densities is achieved.<br />
V ----V---'<br />
Figure 1<br />
Table I: Spectral Densities for 1-Decanol-1-13C in Diglyme at 0 C.<br />
Spectral<br />
Density<br />
JAX<br />
JXX<br />
JXAX<br />
JAXX<br />
JA<br />
Jx<br />
i)o(<br />
Wi<strong>th</strong>out J-Spectral<br />
Preparation<br />
0.09751 (0.00093)<br />
0.06625 (0.0068)<br />
0.00606 (0.0027)<br />
0.05794 (0.0013)<br />
0.0 (locked)<br />
0.05553 (0.0074)<br />
0.065 (0.0323)<br />
Wi<strong>th</strong> J-Spectral<br />
Preparation<br />
0.09645 (0.00076)<br />
0.06219 (0.0033)<br />
0.00399 (0.0025)<br />
0.05635 (0.00091)<br />
0.0 (locked)<br />
0.06456 (0.0038)<br />
0.033 (0.0047)<br />
87 12D CHEMICAL SHIFT ANISOTROPY CORRELATION SPECTROSCOPY. A NEW<br />
SAMPLE POSITIORING MECHANISM WHICH SIMPLIFIES MEASUREMENT OF CHEMICAL SHIFT<br />
ANISOTROPIES IN COMPLEX SINGLE CRYSTALS. Mark H. Sherwood*, D.W. Alderman, &<br />
D.M. Grant, Dept. of Chemistry, University of Utah, Salt Lake City, UT 84112<br />
2D chemical shift anisotropy (CSA) correlation spectroscopy permits <strong>th</strong>e<br />
measurement of CSA tensors in complex single crystals wi<strong>th</strong> far more peaks <strong>th</strong>an<br />
have been tractable wi<strong>th</strong> 1D techniques (1). Such measurements open <strong>th</strong>e<br />
possibility of using CSA tensors as structural and conformational probes in<br />
large molecules. The basis of <strong>th</strong>e technique is to obtain 2D spectra in which<br />
<strong>th</strong>e peaks are located by <strong>th</strong>e chemical shift at two different single crystal<br />
orientations. The spectra are obtained by moving <strong>th</strong>e crystal between <strong>th</strong>e two<br />
orientations during <strong>th</strong>e mixing time of a chemical exchange 2D pulse sequence.<br />
It will be shown how <strong>th</strong>e complete CSA tensors for all <strong>th</strong>e nuclei in a<br />
complex single crystal can be determined by measuring peak frequencies at only<br />
six well chosen orientations of <strong>th</strong>e crystal and correlating <strong>th</strong>ese measurements<br />
wi<strong>th</strong> <strong>th</strong>e 2D technique. The special geometry of a mechanism to accomplish <strong>th</strong>e<br />
necessary orientation and reorientation will be explained and <strong>th</strong>e device itself<br />
installed in a 200 MHz probe exhibited. In order to measure all <strong>th</strong>e tensors in<br />
a single crystal <strong>th</strong>e sample need be mounted only once in <strong>th</strong>e mechanism and six<br />
2D spectra obtained.<br />
Six 2D spectra which determine <strong>th</strong>e carbon-13 CSA tensors in a single<br />
crystal of sucrose will be shown. Sucrose has 12 carbons per molecule and two<br />
molecules per unit cell so <strong>th</strong>at 24 peaks are observed.<br />
The possibilities of <strong>th</strong>e technique for measurement of tensors in<br />
much more complicated molecules will be discussed.<br />
(1) C.M. Carter, D.W. Alderman, and D.M. Grant, J. Magn. Reson.<br />
6_55, 183 (1985) and 73, 114 (1987).<br />
142