th - 1988 - 51st ENC Conference
th - 1988 - 51st ENC Conference
th - 1988 - 51st ENC Conference
Create successful ePaper yourself
Turn your PDF publications into a flip-book with our unique Google optimized e-Paper software.
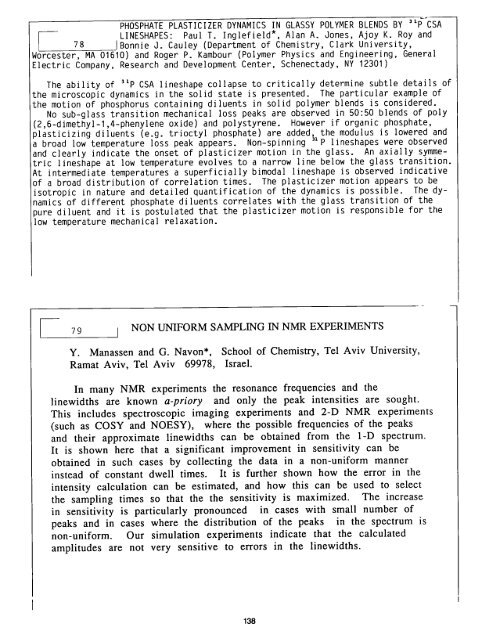
PHOSPHATE PLASTICIZER DYNAMICS IN GLASSY POLYMER BLENDS BY 3~F~ CSA<br />
-- LINESHAPES: Paul T. Inglefield*, Alan A. Jones, Ajoy K. Roy and<br />
I 78 IBonnie J. Cauley (Department of Chemistry, Clark University,<br />
Worcester, MA 01610) and Roger P. Kambour (Polymer Physics and Engineering, General<br />
Electric Company, Research and Development Center, Schenectady, NY 12301)<br />
The ability of 3tp CSA lineshape collapse to critically determine subtle details of<br />
<strong>th</strong>e microscopic dynamics in <strong>th</strong>e solid state is presented. The particular example of<br />
<strong>th</strong>e motion of phosphorus containing diluents in solid polymer blends is considered.<br />
No sub-glass transition mechanical loss peaks are observed in 50:50 blends of poly<br />
(2,6-dime<strong>th</strong>yl-1,4-phenylene oxide) and polystyrene. However if organic phosphate,<br />
)lasticizing diluents (e.g. trioctyl phosphate) are added, <strong>th</strong>e modulus is lowered and<br />
a broad low temperature loss peak appears. Non-spinning 3Xp lineshapes were observed<br />
and clearly indicate <strong>th</strong>e onset of plasticizer motion in <strong>th</strong>e glass. An axially symme-<br />
tric lineshape at low temperature evolves to a narrow line below <strong>th</strong>e glass transition.<br />
At intermediate temperatures a superficially bimodal lineshape is observed indicative<br />
of a broad distribution of correlation times. The plasticizer motion appears to be<br />
isotropic in nature and detailed quantification of <strong>th</strong>e dynamics is possible. The dy-<br />
namics of different phosphate diluents correlates wi<strong>th</strong> <strong>th</strong>e glass transition of <strong>th</strong>e<br />
pure diluent and it is postulated <strong>th</strong>at <strong>th</strong>e plasticizer motion is responsible for <strong>th</strong>e<br />
low temperature mechanical relaxation.<br />
7 9 I NON UNIFORM SAMPLING IN NMR EXPERIMENTS<br />
Y. Manassen and G. Navon*, School of Chemistry, Tel Aviv University,<br />
Ramat Aviv, Tel Aviv 69978, Israel.<br />
In many NMR experiments <strong>th</strong>e resonance frequencies and <strong>th</strong>e<br />
linewid<strong>th</strong>s are known a-priory and only <strong>th</strong>e peak intensities are sought.<br />
This includes spectroscopic imaging experiments and 2-D NMR experiments<br />
(such as COSY and NOESY), where <strong>th</strong>e possible frequencies of <strong>th</strong>e peaks<br />
and <strong>th</strong>eir approximate linewid<strong>th</strong>s can be obtained from <strong>th</strong>e 1-D spectrum.<br />
It is shown here <strong>th</strong>at a significant improvement in sensitivity can be<br />
obtained in such cases by collecting <strong>th</strong>e data in a non-uniform manner<br />
instead of constant dwell times. It is fur<strong>th</strong>er shown how <strong>th</strong>e error in <strong>th</strong>e<br />
intensity calculation can be estimated, and how <strong>th</strong>is can be used to select<br />
<strong>th</strong>e sampling times so <strong>th</strong>at <strong>th</strong>e <strong>th</strong>e sensitivity is maximized. The increase<br />
in sensitivity is particularly pronounced in cases wi<strong>th</strong> small number of<br />
peaks and in cases where <strong>th</strong>e distribution of <strong>th</strong>e peaks in <strong>th</strong>e spectrum is<br />
non-uniform. Our simulation experiments indicate <strong>th</strong>at <strong>th</strong>e calculated<br />
amplitudes are not very sensitive to errors in <strong>th</strong>e linewid<strong>th</strong>s.<br />
138


