

Perspektive Österreich Wandel Chancen Impulse
broschuere_perspektive_oesterreich
broschuere_perspektive_oesterreich

Create successful ePaper yourself
Turn your PDF publications into a flip-book with our unique Google optimized e-Paper software.
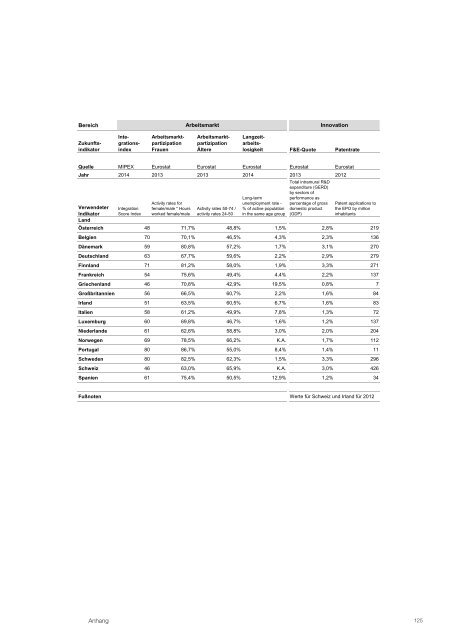
Bereich<br />
Bildung Arbeitsmarkt<br />
Innovation<br />
Zukunftsindikator<br />
Inte-<br />
Arbeitsmarktpartizipation<br />
Bildungspartizipatioarbeits-<br />
Arbeitsmarkt-<br />
Jugendgrationsindemobilität<br />
Frauen qualität Ältere<br />
Bildungslosigkeit<br />
Langzeitarbeitslosigkeit<br />
F&E-Quote<br />
Patentrate<br />
Quelle MIPEX OECD Eurostat OECD Eurostat Eurostat Eurostat<br />
Jahr 20142012 2013 2012 2013 2014 2014<br />
Verwendeter<br />
Indikator<br />
Land<br />
Odds (ratio) to access<br />
higher education by<br />
parents' educational<br />
Durchschnittlicher<br />
PISA Score in den Youth unemployment Long-term<br />
background; Activity below rates Bereichen for Mathematik, rate (15-24 years unemployment old) - rate -<br />
Integration upper secondary female/male Wissenschaft, * Hours Activity und rates % 50-74 of active / population % of active population<br />
Score attainment Index worked female/male Lesen activity rates in 24-50 the same age in the same age group<br />
<strong>Österreich</strong> 48 20% 71,7% 500 48,8% 10,3% 1,5%<br />
Belgien 70 32% 70,1% 510 46,5% 23,2% 4,3%<br />
Dänemark 59 47% 80,8% 498 57,2% 12,6% 1,7%<br />
Deutschland 63 35% 67,7% 515 59,6% 7,7% 2,2%<br />
Finnland 71 40% 81,2% 529 58,0% 20,5% 1,9%<br />
Frankreich 54 40% 75,6% 500 49,4% 24,2% 4,4%<br />
Griechenland 46 K.A. 70,8% 466 42,9% 52,4% 19,5%<br />
Großbritannien 56 K.A. 66,5% 502 60,7% 16,9% 2,2%<br />
Irland 51 48% 63,5% 516 60,5% 23,9% 6,7%<br />
Italien 58 44% 61,2% 490 49,9% 42,7% 7,8%<br />
Luxemburg 60 K.A. 69,8% 490 46,7% 22,0% 1,6%<br />
Niederlande 61 42% 62,6% 519 58,8% 12,7% 3,0%<br />
Norwegen 69 59% 78,5% 496 66,2% K.A. K.A.<br />
Portugal 80 K.A. 86,7% 488 55,0% 34,7% 8,4%<br />
Schweden 80 40% 82,5% 482 62,3% 22,9% 1,5%<br />
Schweiz 46 K.A. 63,0% 518 65,9% K.A. K.A.<br />
Spanien 61 60% 75,4% 490 50,5% 53,2% 12,9%<br />
Eurostat<br />
Eurostat<br />
2013 2012<br />
Total intramural R&D<br />
expenditure (GERD)<br />
by sectors of<br />
performance as<br />
percentage of gross<br />
domestic product<br />
(GDP)<br />
Patent applications to<br />
the EPO by million<br />
inhabitants<br />
2,8% 219<br />
2,3% 136<br />
3,1% 270<br />
2,9% 279<br />
3,3% 271<br />
2,2% 137<br />
0,8% 7<br />
1,6% 84<br />
1,6% 83<br />
1,3% 72<br />
1,2% 137<br />
2,0% 204<br />
1,7% 112<br />
1,4% 11<br />
3,3% 296<br />
3,0% 426<br />
1,2% 34<br />
Fußnoten<br />
Werte für Schweiz und Irland für 2012<br />
Anhang<br />
125