

Perspektive Österreich Wandel Chancen Impulse
broschuere_perspektive_oesterreich
broschuere_perspektive_oesterreich

You also want an ePaper? Increase the reach of your titles
YUMPU automatically turns print PDFs into web optimized ePapers that Google loves.
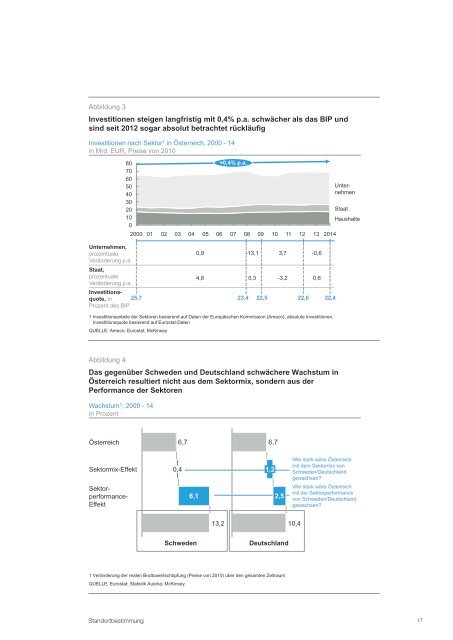
Abbildung 3<br />
Investitionen steigen langfristig mit 0,4% p.a. schwächer als das BIP und<br />
sind seit 2012 sogar absolut betrachtet rückläufig<br />
Investitionen nach Sektor 1 in <strong>Österreich</strong>, 2000 - 14<br />
in Mrd. EUR, Preise von 2010<br />
80<br />
70<br />
60<br />
50<br />
40<br />
30<br />
20<br />
10<br />
0<br />
+0,4% p.a.<br />
2000 01 02 03 04 05 06 07 08 09 10 11 12 13 2014<br />
Staat<br />
Haushalte<br />
Unternehmen,<br />
prozentuale<br />
Veränderung p.a.<br />
Staat,<br />
prozentuale<br />
Veränderung p.a.<br />
Unternehmen<br />
Investitionsquote,<br />
in 25,7<br />
Prozent des BIP<br />
0,9 -13,1 3,7 -0,6<br />
4,8 0,3 -3,2 0,6<br />
23,4 22,5<br />
22,6 22,4<br />
1 Investitionsanteile der Sektoren basierend auf Daten der Europäischen Kommission (Ameco); absolute Investitionen,<br />
Investitionsquote basierend auf Eurostat-Daten<br />
QUELLE: Ameco; Eurostat; McKinsey<br />
Abbildung 4<br />
Das gegenüber Schweden und Deutschland schwächere Wachstum in<br />
<strong>Österreich</strong> resultiert nicht aus dem Sektormix, sondern aus der<br />
Performance der Sektoren<br />
Wachstum 1 , 2009 - 14<br />
in Prozent<br />
<strong>Österreich</strong><br />
6,7<br />
6,7<br />
Sektormix-Effekt<br />
0,4<br />
1,2<br />
Wie stark wäre <strong>Österreich</strong><br />
mit dem Sektormix von<br />
Schweden/Deutschland<br />
gewachsen?<br />
Sektor-<br />
performance-<br />
Effekt<br />
6,1<br />
2,5<br />
Wie stark wäre <strong>Österreich</strong><br />
mit der Sektorperformance<br />
von Schweden/Deutschland<br />
gewachsen?<br />
13,2<br />
10,4<br />
Schweden<br />
Deutschland<br />
1 Veränderung der realen Bruttowertschöpfung (Preise von 2010) über den gesamten Zeitraum<br />
QUELLE: Eurostat; Statistik Austria; McKinsey<br />
Standortbestimmung<br />
17