

Perspektive Österreich Wandel Chancen Impulse
broschuere_perspektive_oesterreich
broschuere_perspektive_oesterreich

You also want an ePaper? Increase the reach of your titles
YUMPU automatically turns print PDFs into web optimized ePapers that Google loves.
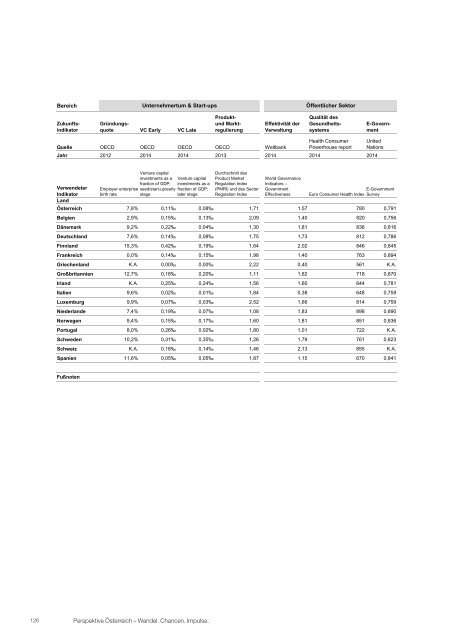
Bereich<br />
Unternehmertum Bildung & Start-ups<br />
Öffentlicher Sektor<br />
Zukunftsindikator<br />
Jugend-Produkt-<br />
Gründungsquotmobilität<br />
Bildungs-<br />
Bildungsarbeits-und<br />
Marktregulierung<br />
VC Early qualität VC Late losigkeit<br />
Effektivität der<br />
Verwaltung<br />
Qualität des<br />
Gesundheitssystems<br />
E-Government<br />
Quelle OECD OECD OECD OECD OECD EurostatOECD<br />
Jahr 2012 2012 20142012 2014 2014 2013<br />
Odds (ratio) to access<br />
higher education by Venture Durchschnittlicher<br />
capital<br />
Durchschnitt des<br />
parents' educational investments PISA Score as a in Venture den capital Youth unemployment<br />
Product Market<br />
background; belowfraction Bereichen of GDP; Mathematik, investments rate as (15-24 a Regulation years old) Index -<br />
Verwendeter Employer upper secondary enterprise seed/start-up/early<br />
Wissenschaft, fraction und of % GDP; of active (PMRI) population und des Sector<br />
Indikator<br />
birth attainment rate<br />
stage Lesen later stagein the same Regulation age Index<br />
Land<br />
<strong>Österreich</strong> 7,8% 20% 0,11‰ 500 0,08‰ 10,3% 1,71<br />
Belgien 2,9% 32% 0,15‰ 510 0,13‰ 23,2% 2,09<br />
Dänemark 9,2% 47% 0,22‰ 498 0,04‰ 12,6% 1,30<br />
Deutschland 7,6% 35% 0,14‰ 515 0,08‰ 7,7% 1,75<br />
Finnland 15,3% 40% 0,42‰ 529 0,19‰ 20,5% 1,64<br />
Frankreich 0,0% 40% 0,14‰ 500 0,15‰ 24,2% 1,98<br />
Griechenland K.A. K.A. 0,00‰ 466 0,00‰ 52,4% 2,22<br />
Großbritannien 12,7% K.A. 0,18‰ 502 0,20‰ 16,9% 1,11<br />
Irland K.A. 48% 0,25‰ 516 0,24‰ 23,9% 1,56<br />
Italien 9,6% 44% 0,02‰ 490 0,01‰ 42,7% 1,84<br />
Luxemburg 9,9% K.A. 0,07‰ 490 0,03‰ 22,0% 2,52<br />
Niederlande 7,4% 42% 0,19‰ 519 0,07‰ 12,7% 1,08<br />
Norwegen 9,4% 59% 0,15‰ 496 0,17‰ K.A. 1,60<br />
Portugal 8,0% K.A. 0,26‰ 488 0,02‰ 34,7% 1,80<br />
Schweden 10,2% 40% 0,31‰ 482 0,35‰ 22,9% 1,26<br />
Schweiz K.A. K.A. 0,18‰ 518 0,14‰ K.A. 1,46<br />
Spanien 11,6% 60% 0,05‰ 490 0,05‰ 53,2% 1,87<br />
Health Consumer United<br />
Weltbank Powerhouse report Nations<br />
2014 2014 2014<br />
World Governance<br />
Indicators –<br />
Government<br />
Effectiveness<br />
Euro Consumer Health Index<br />
E-Government<br />
Survey<br />
1,57 780 0,791<br />
1,40 820 0,756<br />
1,81 836 0,816<br />
1,73 812 0,786<br />
2,02 846 0,845<br />
1,40 763 0,894<br />
0,40 561 K.A.<br />
1,62 718 0,870<br />
1,60 644 0,781<br />
0,38 648 0,759<br />
1,66 814 0,759<br />
1,83 898 0,890<br />
1,81 851 0,836<br />
1,01 722 K.A.<br />
1,79 761 0,823<br />
2,13 855 K.A.<br />
1,15 670 0,841<br />
Fußnoten<br />
126 <strong>Perspektive</strong> <strong>Österreich</strong> – <strong>Wandel</strong>. <strong>Chancen</strong>. <strong>Impulse</strong>.