
Create successful ePaper yourself
Turn your PDF publications into a flip-book with our unique Google optimized e-Paper software.
Fugro<br />
Netherlands/Oil Services Analyser<br />
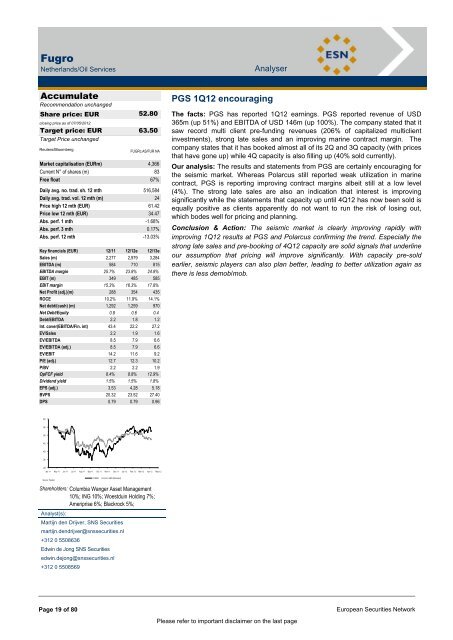
Fugro (Accumulate)<br />
Accumulate<br />
Recommendation unchanged<br />
Share price: EUR<br />
closing price as of 07/05/2012<br />
Target price: EUR<br />
Target Price unchanged<br />
Reuters/Bloomberg<br />
52.80<br />
63.50<br />
FUGRc.AS/FUR NA<br />
Market capitalisation (EURm) 4,366<br />
Current N° of shares (m) 83<br />
Free float 67%<br />
Daily avg. no. trad. sh. 12 mth 516,584<br />
Daily avg. trad. vol. 12 mth (m) 24<br />
Price high 12 mth (EUR) 61.42<br />
Price low 12 mth (EUR) 34.47<br />
Abs. perf. 1 mth -1.68%<br />
Abs. perf. 3 mth 0.17%<br />
Abs. perf. 12 mth -13.03%<br />
Key financials (EUR) 12/11 12/12e 12/13e<br />
Sales (m) 2,277 2,979 3,284<br />
EBITDA (m) 584 710 815<br />
EBITDA margin 25.7% 23.8% 24.8%<br />
EBIT (m) 349 485 585<br />
EBIT margin 15.3% 16.3% 17.8%<br />
Net Profit (adj.)(m) 288 354 435<br />
ROCE 10.2% 11.9% 14.1%<br />
Net debt/(cash) (m) 1,292 1,259 970<br />
Net Debt/Equity 0.8 0.6 0.4<br />
Debt/EBITDA 2.2 1.8 1.2<br />
Int. cover(EBITDA/Fin. int) 43.4 22.2 27.2<br />
EV/Sales 2.2 1.9 1.6<br />
EV/EBITDA 8.5 7.9 6.6<br />
EV/EBITDA (adj.) 8.5 7.9 6.6<br />
EV/EBIT 14.2 11.6 9.2<br />
P/E (adj.) 12.7 12.3 10.2<br />
P/BV 2.2 2.2 1.9<br />
OpFCF yield 8.4% 8.8% 12.9%<br />
Dividend yield 1.5% 1.5% 1.8%<br />
EPS (adj.) 3.53 4.28 5.18<br />
BVPS 20.32 23.52 27.40<br />
DPS 0.79 0.79 0.96<br />
60 vvdsvdvsdy<br />
55<br />
50<br />
45<br />
40<br />
35<br />
30<br />
Apr 11 May 11 Jun 11 Jul 11 Aug 11 Sep 11 Oct 11 Nov 11 Dec 11 Jan 12 Feb 12 Mar 12 Apr 12 May 12<br />
Source: Factset<br />
FUGRO AEX (Rebased)<br />
Shareholders: Columbia Wanger Asset Management<br />
10%; ING 10%; Woestduin Holding 7%;<br />
Ameriprise 6%; Blackrock 5%;<br />
Analyst(s):<br />
Martijn den Drijver, SNS Securities<br />
martijn.dendrijver@snssecurities.nl<br />
+312 0 5508636<br />
Edwin de Jong SNS Securities<br />
edwin.dejong@snssecurities.nl<br />
+312 0 5508569<br />
PGS 1Q12 encouraging<br />
The facts: PGS has reported 1Q12 earnings. PGS reported revenue of USD<br />
365m (up 51%) and EBITDA of USD 146m (up 100%). The company stated that it<br />
saw record multi client pre-funding revenues (206% of capitalized multiclient<br />
investments), strong late sales and an improving marine contract margin. The<br />
company states that it has booked almost all of its 2Q and 3Q capacity (with prices<br />
that have gone up) while 4Q capacity is also filling up (40% sold currently).<br />
Our analysis: The results and statements from PGS are certainly encouraging for<br />
the seismic market. Whereas Polarcus still reported weak utilization in marine<br />
contract, PGS is reporting improving contract margins albeit still at a low level<br />
(4%). The strong late sales are also an indication that interest is improving<br />
significantly while the statements that capacity up until 4Q12 has now been sold is<br />
equally positive as clients apparently do not want to run the risk of losing out,<br />
which bodes well for pricing and planning.<br />
Conclusion & Action: The seismic market is clearly improving rapidly with<br />
improving 1Q12 results at PGS and Polarcus confirming the trend. Especially the<br />
strong late sales and pre-booking of 4Q12 capacity are solid signals that underline<br />
our assumption that pricing will improve significantly. With capacity pre-sold<br />
earlier, seismic players can also plan better, leading to better utilization again as<br />
there is less demob/mob.<br />
Page 19 of 80 European Securities Network<br />
Please refer to important disclaimer on the last page