
You also want an ePaper? Increase the reach of your titles
YUMPU automatically turns print PDFs into web optimized ePapers that Google loves.
Recticel<br />
Belgium/Chemicals Analyser<br />
Recticel (Hold)<br />
Hold<br />
Recommendation unchanged<br />
Share price: EUR<br />
closing price as of 07/05/2012<br />
Target price: EUR<br />
Target Price unchanged<br />
Reuters/Bloomberg<br />
5.50<br />
6.00<br />
RECT.BR/REC BB<br />
Market capitalisation (EURm) 159<br />
Current N° of shares (m) 29<br />
Free float 61%<br />
Daily avg. no. trad. sh. 12 mth 31,931<br />
Daily avg. trad. vol. 12 mth (m) 0<br />
Price high 12 mth (EUR) 7.80<br />
Price low 12 mth (EUR) 3.80<br />
Abs. perf. 1 mth -2.14%<br />
Abs. perf. 3 mth 11.11%<br />
Abs. perf. 12 mth -27.82%<br />
Key financials (EUR) 12/11 12/12e 12/13e<br />
Sales (m) 1,378 1,359 1,408<br />
EBITDA (m) 89 90 103<br />
EBITDA margin 6.4% 6.7% 7.3%<br />
EBIT (m) 42 47 59<br />
EBIT margin 3.0% 3.5% 4.2%<br />
Net Profit (adj.)(m) 17 22 31<br />
ROCE 6.1% 6.6% 8.0%<br />
Net debt/(cash) (m) 150 159 153<br />
Net Debt/Equity 0.6 0.6 0.5<br />
Debt/EBITDA 1.7 1.8 1.5<br />
Int. cover(EBITDA/Fin. int) 6.7 7.8 8.8<br />
EV/Sales 0.2 0.2 0.2<br />
EV/EBITDA 3.4 3.7 3.2<br />
EV/EBITDA (adj.) 3.4 3.7 3.2<br />
EV/EBIT 7.2 7.2 5.6<br />
P/E (adj.) 7.6 7.2 5.1<br />
P/BV 0.5 0.6 0.6<br />
OpFCF yield 25.7% 25.1% 26.0%<br />
Dividend yield 5.1% 5.5% 6.4%<br />
EPS (adj.) 0.60 0.76 1.07<br />
BVPS 8.60 9.08 9.85<br />
DPS 0.28 0.30 0.35<br />
8.0vvdsvdvsdy<br />
7.5<br />
7.0<br />
6.5<br />
6.0<br />
5.5<br />
5.0<br />
4.5<br />
4.0<br />
3.5<br />
Apr 11 May 11 Jun 11 Jul 11 Aug 11 Sep 11 Oct 11 Nov 11 Dec 11 Jan 12 Feb 12 Mar 12 Apr 12 May 12<br />
RECTICEL Belgium All Share (Rebased)<br />
Shareholders: Cie Bois Sauvage 29%;<br />
Sihold/Vean/Lennart/Sallas 9%; Rec-Man<br />
1.02%;<br />
Analyst(s):<br />
Bernard Hanssens, Bank Degroof<br />
bernard.hanssens@degroof.be<br />
+32 (0) 2 287 9689<br />
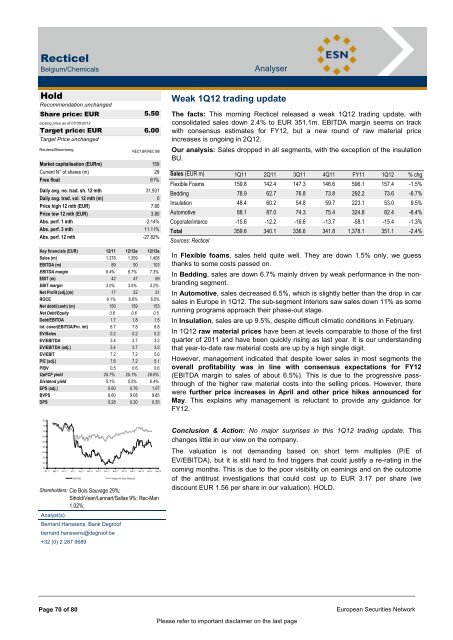
Weak 1Q12 trading update<br />
The facts: This morning Recticel released a weak 1Q12 trading update, with<br />
consolidated sales down 2.4% to EUR 351.1m. EBITDA margin seems on track<br />
with consensus estimates for FY12, but a new round of raw material price<br />
increases is ongoing in 2Q12.<br />
Our analysis: Sales dropped in all segments, with the exception of the insulation<br />
BU.<br />
Sales (EUR m) 1Q11 2Q11 3Q11 4Q11 FY11 1Q12 % chg<br />
Flexible Foams 159.8 142.4 147.3 146.6 596.1 157.4 -1.5%<br />
Bedding 78.9 62.7 76.8 73.8 292.2 73.6 -6.7%<br />
Insulation 48.4 60.2 54.8 59.7 223.1 53.0 9.5%<br />
Automotive 88.1 87.0 74.3 75.4 324.8 82.4 -6.4%<br />
Coporate/interco -15.6 -12.2 -16.6 -13.7 -58.1 -15.4 -1.3%<br />
Total 359.6 340.1 336.6 341.8 1,378.1 351.1 -2.4%<br />
Sources: Recticel<br />
In Flexible foams, sales held quite well. They are down 1.5% only, we guess<br />
thanks to some costs passed on.<br />
In Bedding, sales are down 6.7% mainly driven by weak performance in the nonbranding<br />
segment.<br />
In Automotive, sales decreased 6.5%, which is slightly better than the drop in car<br />
sales in Europe in 1Q12. The sub-segment Interiors saw sales down 11% as some<br />
running programs approach their phase-out stage.<br />
In Insulation, sales are up 9.5%, despite difficult climatic conditions in February.<br />
In 1Q12 raw material prices have been at levels comparable to those of the first<br />
quarter of 2011 and have been quickly rising as last year. It is our understanding<br />
that year-to-date raw material costs are up by a high single digit.<br />
However, management indicated that despite lower sales in most segments the<br />
overall profitability was in line with consensus expectations for FY12<br />
(EBITDA margin to sales of about 6.5%). This is due to the progressive passthrough<br />
of the higher raw material costs into the selling prices. However, there<br />
were further price increases in April and other price hikes announced for<br />
May. This explains why management is reluctant to provide any guidance for<br />
FY12.<br />
Conclusion & Action: No major surprises in this 1Q12 trading update. This<br />
changes little in our view on the company.<br />
The valuation is not demanding based on short term multiples (P/E of<br />
EV/EBITDA), but it is still hard to find triggers that could justify a re-rating in the<br />
coming months. This is due to the poor visibility on earnings and on the outcome<br />
of the antitrust investigations that could cost up to EUR 3.17 per share (we<br />
discount EUR 1.56 per share in our valuation). HOLD.<br />
Page 70 of 80 European Securities Network<br />
Please refer to important disclaimer on the last page