
Create successful ePaper yourself
Turn your PDF publications into a flip-book with our unique Google optimized e-Paper software.
BCP<br />
Portugal/Banks Analyser<br />
BCP (Buy)<br />
Buy<br />
Recommendation unchanged<br />
Share price: EUR<br />
closing price as of 07/05/2012<br />
Target price: EUR<br />
Target Price unchanged<br />
Reuters/Bloomberg<br />
0.11<br />
0.40<br />
BCP.LS/BCP PL<br />
Market capitalisation (EURm) 793<br />
Current N° of shares (m) 7,207<br />
Free float 60%<br />
Daily avg. no. trad. sh. 12 mth 65,810,336<br />
Daily avg. trad. vol. 12 mth (m) 15<br />
Price high 12 mth (EUR) 0.54<br />
Price low 12 mth (EUR) 0.10<br />
Abs. perf. 1 mth -13.39%<br />
Abs. perf. 3 mth -37.50%<br />
Abs. perf. 12 mth -79.91%<br />
Key financials (EUR) 12/11 12/12e 12/13e<br />
Total Revenue (m) 2,555 2,606 2,787<br />
Pre-Provision Profit (PPP) (m) 632 1,040 1,200<br />
Operating profit (OP) -1,236 160 473<br />
Earnings Before Tax (m) -1,222 184 498<br />
Net Profit (adj.) (m) -849 31 248<br />
Shareholders Equity (m) 3,827 2,994 3,184<br />
Tangible BV (m) 5,277 6,148 6,268<br />
RWA (m) 55,254 53,390 51,503<br />
ROE (adj.) -16.3% 0.5% 4.0%<br />
Tier1 Ratio 8.7% 8.6% 9.0%<br />
Cost/Income 64.0% 56.4% 53.7%<br />
P/PPP 1.6 0.8 0.7<br />
P/E (adj.) nm 25.8 3.2<br />
P/BV 0.3 0.3 0.2<br />
P/NAV 0.2 0.1 0.1<br />
Dividend Yield 26.7% 0.0% 0.0%<br />
PPPPS 0.09 0.14 0.17<br />
EPS (adj.) -0.12 0.00 0.03<br />
BVPS 0.53 0.42 0.44<br />
NAVPS 0.73 0.85 0.87<br />
DPS 0.03 0.00 0.00<br />
0.55 vvdsvdvsdy<br />
0.50<br />
0.45<br />
0.40<br />
0.35<br />
0.30<br />
0.25<br />
0.20<br />
0.15<br />
0.10<br />
Apr 11 May 11 Jun 11 Jul 11 Aug 11 Sep 11 Oct 11 Nov 11 Dec 11 Jan 12 Feb 12 Mar 12 Apr 12 May 12<br />
Source: Factset<br />
BCP Stox x Banks (Rebased)<br />
Shareholders: Sonangol 12%; Teixeira Duarte Group<br />
6%; Ocidental -Seguros de Vida, S.A.<br />
5%; Fundação Berardo & Metalgest 4%;<br />
Analyst(s):<br />
André Rodrigues, Caixa-Banco de Investimento<br />
andre.rodrigues@caixabi.pt<br />
+351 21 389 68 39<br />
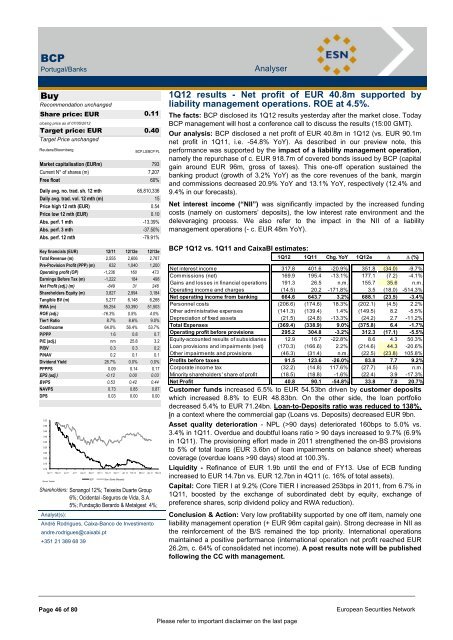
1Q12 results - Net profit of EUR 40.8m supported by<br />
liability management operations. ROE at 4.5%.<br />
The facts: BCP disclosed its 1Q12 results yesterday after the market close. Today<br />
BCP management will host a conference call to discuss the results (15:00 GMT).<br />
Our analysis: BCP disclosed a net profit of EUR 40.8m in 1Q12 (vs. EUR 90.1m<br />
net profit in 1Q11, i.e. -54.8% YoY). As described in our preview note, this<br />
performance was supported by the impact of a liability management operation,<br />
namely the repurchase of c. EUR 918.7m of covered bonds issued by BCP (capital<br />
gain around EUR 96m, gross of taxes). This one-off operation sustained the<br />
banking product (growth of 3.2% YoY) as the core revenues of the bank, margin<br />
and commissions decreased 20.9% YoY and 13.1% YoY, respectively (12.4% and<br />
9.4% in our forecasts).<br />
Net interest income (“NII”) was significantly impacted by the increased funding<br />
costs (namely on customers‟ deposits), the low interest rate environment and the<br />
deleveraging process. We also refer to the impact in the NII of a liability<br />
management operations (- c. EUR 48m YoY).<br />
BCP 1Q12 vs. 1Q11 and CaixaBI estimates:<br />
Customer funds increased 6.5% to EUR 54.53bn driven by customer deposits<br />
which increased 8.8% to EUR 48.83bn. On the other side, the loan portfolio<br />
decreased 5.4% to EUR 71.24bn. Loan-to-Deposits ratio was reduced to 138%,<br />
in a context where the commercial gap (Loans vs. Deposits) decreased EUR 9bn.<br />
Asset quality deterioration - NPL (>90 days) deteriorated 160bps to 5.0% vs.<br />
3.4% in 1Q11. Overdue and doubtful loans ratio > 90 days increased to 9.7% (6.9%<br />
in 1Q11). The provisioning effort made in 2011 strengthened the on-BS provisions<br />
to 5% of total loans (EUR 3.6bn of loan impairments on balance sheet) whereas<br />
coverage (overdue loans >90 days) stood at 100.3%.<br />
Liquidity - Refinance of EUR 1.9b until the end of FY13. Use of ECB funding<br />
increased to EUR 14.7bn vs. EUR 12.7bn in 4Q11 (c. 16% of total assets).<br />
Capital: Core TIER I at 9.2% (Core TIER I increased 253bps in 2011, from 6.7% in<br />
1Q11, boosted by the exchange of subordinated debt by equity, exchange of<br />
preference shares, scrip dividend policy and RWA reduction).<br />
Conclusion & Action: Very low profitability supported by one off item, namely one<br />
liability management operation (+ EUR 96m capital gain). Strong decrease in NII as<br />
the reinforcement of the B/S remained the top priority. International operations<br />
maintained a positive performance (international operation net profit reached EUR<br />
26.2m, c. 64% of consolidated net income). A post results note will be published<br />
following the CC with management.<br />
Page 46 of 80 European Securities Network<br />
Please refer to important disclaimer on the last page<br />
1Q12 1Q11 Chg. YoY 1Q12e (%)<br />
Net interest income 317.8 401.6 -20.9% 351.8 (34.0) -9.7%<br />
Commissions (net) 169.9 195.4 -13.1% 177.1 (7.2) -4.1%<br />
Gains and losses in financial operations 191.3 26.5 n.m. 155.7 35.6 n.m.<br />
Operating income and charges (14.5) 20.2 -171.8% 3.5 (18.0) -514.3%<br />
Net operating income from banking 664.6 643.7 3.2% 688.1 (23.5) -3.4%<br />
Personnel costs (206.6) (174.6) 18.3% (202.1) (4.5) 2.2%<br />
Other administrative expenses (141.3) (139.4) 1.4% (149.5) 8.2 -5.5%<br />
Depreciation of fixed assets (21.5) (24.8) -13.3% (24.2) 2.7 -11.2%<br />
Total Expenses (369.4) (338.9) 9.0% (375.8) 6.4 -1.7%<br />
Operating profit before provisions 295.2 304.8 -3.2% 312.3 (17.1) -5.5%<br />
Equity-accounted results of subsidiaries 12.9 16.7 -22.8% 8.6 4.3 50.3%<br />
Loan provisions and impairments (net) (170.3) (166.6) 2.2% (214.6) 44.3 -20.6%<br />
Other impairments and provisions (46.3) (31.4) n.m. (22.5) (23.8) 105.8%<br />
Profits before taxes 91.5 123.6 -26.0% 83.8 7.7 9.2%<br />
Corporate income tax (32.2) (14.8) 117.6% (27.7) (4.5) n.m.<br />
Minority shareholders' share of profit (18.5) (18.8) -1.6% (22.4) 3.9 -17.3%<br />
Net Profit 40.8 90.1 -54.8% 33.8 7.0 20.7%