
Create successful ePaper yourself
Turn your PDF publications into a flip-book with our unique Google optimized e-Paper software.
Solvay<br />
Belgium/Chemicals Analyser<br />
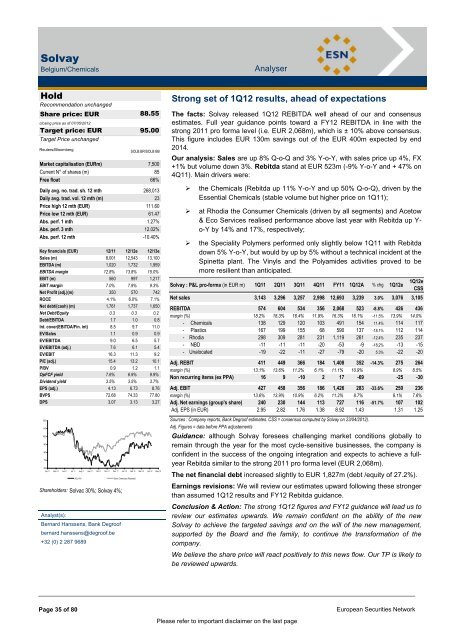
Solvay (Hold)<br />
Hold<br />
Recommendation unchanged<br />
Share price: EUR<br />
closing price as of 07/05/2012<br />
Target price: EUR<br />
Target Price unchanged<br />
Reuters/Bloomberg<br />
88.55<br />
95.00<br />
SOLB.BR/SOLB BB<br />
Market capitalisation (EURm) 7,500<br />
Current N° of shares (m) 85<br />
Free float 66%<br />
Daily avg. no. trad. sh. 12 mth 268,013<br />
Daily avg. trad. vol. 12 mth (m) 23<br />
Price high 12 mth (EUR) 111.60<br />
Price low 12 mth (EUR) 61.47<br />
Abs. perf. 1 mth 1.27%<br />
Abs. perf. 3 mth 12.02%<br />
Abs. perf. 12 mth -10.40%<br />
Key financials (EUR) 12/11 12/12e 12/13e<br />
Sales (m) 8,001 12,543 13,100<br />
EBITDA (m) 1,020 1,732 1,959<br />
EBITDA margin 12.8% 13.8% 15.0%<br />
EBIT (m) 560 997 1,217<br />
EBIT margin 7.0% 7.9% 9.3%<br />
Net Profit (adj.)(m) 350 570 742<br />
ROCE 4.1% 6.0% 7.1%<br />
Net debt/(cash) (m) 1,761 1,737 1,650<br />
Net Debt/Equity 0.3 0.3 0.2<br />
Debt/EBITDA 1.7 1.0 0.8<br />
Int. cover(EBITDA/Fin. int) 8.5 9.7 11.0<br />
EV/Sales 1.1 0.9 0.9<br />
EV/EBITDA 9.0 6.5 5.7<br />
EV/EBITDA (adj.) 7.6 6.1 5.4<br />
EV/EBIT 16.3 11.3 9.2<br />
P/E (adj.) 15.4 13.2 10.1<br />
P/BV 0.9 1.2 1.1<br />
OpFCF yield 7.6% 6.9% 9.9%<br />
Dividend yield 3.5% 3.5% 3.7%<br />
EPS (adj.) 4.13 6.73 8.76<br />
BVPS 72.68 74.33 77.80<br />
DPS 3.07 3.13 3.27<br />
120vvdsvdvsdy<br />
110<br />
100<br />
90<br />
80<br />
70<br />
60<br />
Apr 11 May 11 Jun 11 Jul 11 Aug 11 Sep 11 Oct 11 Nov 11 Dec 11 Jan 12 Feb 12 Mar 12 Apr 12 May 12<br />
SOLVAY Stoxx Chemicals (Rebased)<br />
Shareholders: Solvac 30%; Solvay 4%;<br />
Analyst(s):<br />
Bernard Hanssens, Bank Degroof<br />
bernard.hanssens@degroof.be<br />
+32 (0) 2 287 9689<br />
Strong set of 1Q12 results, ahead of expectations<br />
The facts: Solvay released 1Q12 REBITDA well ahead of our and consensus<br />
estimates. Full year guidance points toward a FY12 REBITDA in line with the<br />
strong 2011 pro forma level (i.e. EUR 2,068m), which is ± 10% above consensus.<br />
This figure includes EUR 130m savings out of the EUR 400m expected by end<br />
2014.<br />
Our analysis: Sales are up 8% Q-o-Q and 3% Y-o-Y, with sales price up 4%, FX<br />
+1% but volume down 3%. Rebitda stand at EUR 523m (-9% Y-o-Y and + 47% on<br />
4Q11). Main drivers were:<br />
� the Chemicals (Rebitda up 11% Y-o-Y and up 50% Q-o-Q), driven by the<br />
Essential Chemicals (stable volume but higher price on 1Q11);<br />
� at Rhodia the Consumer Chemicals (driven by all segments) and Acetow<br />
& Eco Services realised performance above last year with Rebitda up Yo-Y<br />
by 14% and 17%, respectively;<br />
� the Speciality Polymers performed only slightly below 1Q11 with Rebitda<br />
down 5% Y-o-Y, but would by up by 5% without a technical incident at the<br />
Spinetta plant. The Vinyls and the Polyamides activities proved to be<br />
more resilient than anticipated.<br />
Solvay : P&L pro-forma (in EUR m) 1Q11 2Q11 3Q11 4Q11 FY11 1Q12A % chg 1Q12e<br />
Page 35 of 80 European Securities Network<br />
Please refer to important disclaimer on the last page<br />
1Q12e<br />
CSS<br />
Net sales 3,143 3,296 3,257 2,998 12,693 3,239 3.0% 3,076 3,105<br />
REBITDA 574 604 534 356 2,068 523 -8.8% 426 436<br />
margin (%) 18.2% 18.3% 16.4% 11.9% 16.3% 16.1% -11.5% 13.9% 14.0%<br />
- Chemicals 138 129 120 103 491 154 11.4% 114 117<br />
- Plastics 167 199 155 68 590 137 -18.1% 112 114<br />
- Rhodia 298 309 281 231 1,119 261 -12.4% 235 237<br />
- NBD -11 -11 -11 -20 -53 -9 -18.2% -13 -15<br />
- Unalocated -19 -22 -11 -27 -79 -20 5.3% -22 -20<br />
Adj. REBIT 411 449 366 184 1,408 352 -14.3% 275 264<br />
margin (%) 13.1% 13.6% 11.2% 6.1% 11.1% 10.9% 8.9% 8.5%<br />
Non recurring items (ex PPA) 16 9 -10 2 17 -69 -25 -30<br />
Adj. EBIT 427 458 356 186 1,426 283 -33.6% 250 236<br />
margin (%) 13.6% 13.9% 10.9% 6.2% 11.2% 8.7% 8.1% 7.6%<br />
Adj. Net earnings (group's share) 240 230 144 113 727 116 -51.7% 107 102<br />
Adj. EPS (in EUR) 2.95 2.82 1.76 1.38 8.92 1.43 1.31 1.25<br />
Sources : Company reports, Bank Degroof estimates. CSS = consensus computed by Solvay on 23/04/2012).<br />
Adj. Figures = data before PPA adjustements<br />
Guidance: although Solvay foresees challenging market conditions globally to<br />
remain through the year for the most cycle-sensitive businesses, the company is<br />
confident in the success of the ongoing integration and expects to achieve a fullyear<br />
Rebitda similar to the strong 2011 pro forma level (EUR 2,068m).<br />
The net financial debt increased slightly to EUR 1,827m (debt /equity of 27.2%).<br />
Earnings revisions: We will review our estimates upward following these stronger<br />
than assumed 1Q12 results and FY12 Rebitda guidance.<br />
Conclusion & Action: The strong 1Q12 figures and FY12 guidance will lead us to<br />
review our estimates upwards. We remain confident on the ability of the new<br />
Solvay to achieve the targeted savings and on the will of the new management,<br />
supported by the Board and the family, to continue the transformation of the<br />
company.<br />
We believe the share price will react positively to this news flow. Our TP is likely to<br />
be reviewed upwards.