
You also want an ePaper? Increase the reach of your titles
YUMPU automatically turns print PDFs into web optimized ePapers that Google loves.
PostNL<br />
Netherlands/Industrial Transportation & Motorways Analyser<br />
PostNL (Buy)<br />
Buy<br />
Recommendation unchanged<br />
Share price: EUR<br />
closing price as of 07/05/2012<br />
Target price: EUR<br />
Target Price unchanged<br />
Reuters/Bloomberg<br />
3.58<br />
5.85<br />
PTNL.AS/PNL NA<br />
Market capitalisation (EURm) 1,450<br />
Current N° of shares (m) 405<br />
Free float 77%<br />
Daily avg. no. trad. sh. 12 mth 3,722,679<br />
Daily avg. trad. vol. 12 mth (m) 15<br />
Price high 12 mth (EUR) 16.42<br />
Price low 12 mth (EUR) 2.03<br />
Abs. perf. 1 mth -19.39%<br />
Abs. perf. 3 mth 15.08%<br />
Abs. perf. 12 mth -77.98%<br />
Key financials (EUR) 12/11 12/12e 12/13e<br />
Sales (m) 4,297 4,414 4,507<br />
EBITDA (m) 485 552 593<br />
EBITDA margin 11.3% 12.5% 13.2%<br />
EBIT (m) 375 439 479<br />
EBIT margin 8.7% 10.0% 10.6%<br />
Net Profit (adj.)(m) 221 239 233<br />
ROCE 291.8% 189.2% 153.4%<br />
Net debt/(cash) (m) 1,002 (619) (297)<br />
Net Debt/Equity 2.4 -0.5 -0.8<br />
Debt/EBITDA 2.1 -1.1 -0.5<br />
Int. cover(EBITDA/Fin. int) 4.8 5.5 6.1<br />
EV/Sales 0.3 0.2 0.3<br />
EV/EBITDA 2.9 1.8 2.1<br />
EV/EBITDA (adj.) 3.3 2.2 2.7<br />
EV/EBIT 3.8 2.2 2.6<br />
P/E (adj.) 4.0 5.5 5.6<br />
P/BV 2.5 1.1 4.1<br />
OpFCF yield -5.2% -1.2% 1.4%<br />
Dividend yield 5.9% 5.0% 15.1%<br />
EPS (adj.) 0.61 0.65 0.63<br />
BVPS 0.99 3.13 0.86<br />
DPS 0.21 0.18 0.54<br />
18 vvdsvdvsdy<br />
16<br />
14<br />
12<br />
10<br />
8<br />
6<br />
4<br />
2<br />
Apr 11 May 11 Jun 11 Jul 11 Aug 11 Sep 11 Oct 11 Nov 11 Dec 11 Jan 12 Feb 12 Mar 12 Apr 12 May 12<br />
Source: Factset<br />
POSTNL AEX (Rebased)<br />
Shareholders: Mackenzie 10%; Causeway 7%;<br />
Manning&Napier 6%;<br />
Analyst(s):<br />
Gert Steens, SNS Securities<br />
gert.steens@snssecurities.nl<br />
+312 0 5508639<br />
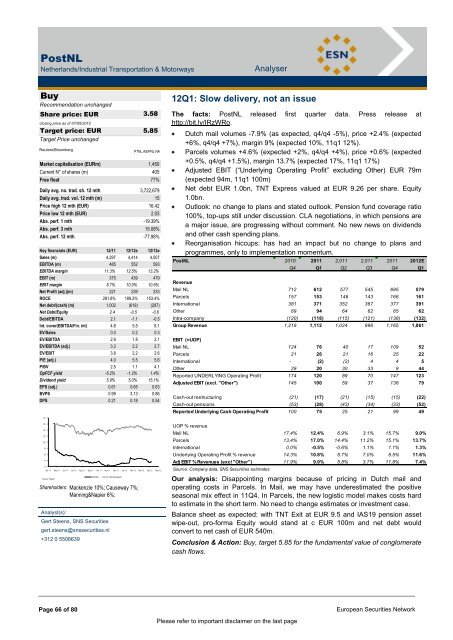
12Q1: Slow delivery, not an issue<br />
The facts: PostNL released first quarter data. Press release at<br />
http://bit.ly/IRzWRo.<br />
Dutch mail volumes -7.9% (as expected, q4/q4 -5%), price +2.4% (expected<br />
+6%, q4/q4 +7%), margin 9% (expected 10%, 11q1 12%).<br />
Parcels volumes +4.6% (expected +2%, q4/q4 +4%), price +0.6% (expected<br />
+0.5%, q4/q4 +1.5%), margin 13.7% (expected 17%, 11q1 17%)<br />
Adjusted EBIT (“Underlying Operating Profit” excluding Other) EUR 79m<br />
(expected 94m, 11q1 100m)<br />
Net debt EUR 1.0bn, TNT Express valued at EUR 9.26 per share. Equity<br />
1.0bn.<br />
Outlook: no change to plans and stated outlook. Pension fund coverage ratio<br />
100%, top-ups still under discussion. CLA negotiations, in which pensions are<br />
a major issue, are progressing without comment. No new news on dividends<br />
and other cash spending plans.<br />
Reorganisation hiccups: has had an impact but no change to plans and<br />
programmes, only to implementation momentum.<br />
PostNL 2010 2011 2,011<br />
Revenue<br />
Mail NL 712<br />
Parcels 157<br />
International 381<br />
Other 89<br />
Intra-company (120)<br />
Group Revenue 1,219<br />
EBIT (=UOP)<br />
Mail NL 124<br />
Parcels 21<br />
International -<br />
Other 29<br />
Reported UNDERLYING Operating Profit 174<br />
Adjusted EBIT (excl. "Other") 145<br />
Cash-out restructuring (21)<br />
Cash-out pensions (53)<br />
Reported Underlying Cash Operating Profit 100<br />
UOP % revenue<br />
Page 66 of 80 European Securities Network<br />
Please refer to important disclaimer on the last page<br />
2,011<br />
2011 2012E<br />
Q4 Q1 Q2 Q3 Q4 Q1<br />
612<br />
153<br />
371<br />
94<br />
(118)<br />
1,112<br />
76<br />
26<br />
(2)<br />
20<br />
577 545<br />
146 143<br />
352<br />
64<br />
(115)<br />
1,024<br />
367<br />
62<br />
(121)<br />
996<br />
40 17<br />
21 16<br />
Mail NL 17.4% 12.4% 6.9% 3.1% 15.7% 9.0%<br />
Parcels 13.4% 17.0% 14.4% 11.2% 15.1% 13.7%<br />
International 0.0% -0.5% -0.6% 1.1% 1.1% 1.3%<br />
Underlying Operating Profit % revenue 14.3% 10.8% 8.7% 7.0% 8.5% 11.6%<br />
Adj EBIT % Revenues (excl "Other") 11.9% 9.0% 5.8% 3.7% 11.8% 7.4%<br />
Source: Company data, SNS Securities estimates<br />
Our analysis: Disappointing margins because of pricing in Dutch mail and<br />
operating costs in Parcels. In Mail, we may have underestimated the positive<br />
seasonal mix effect in 11Q4. In Parcels, the new logistic model makes costs hard<br />
to estimate in the short term. No need to change estimates or investment case.<br />
Balance sheet as expected: with TNT Exit at EUR 9.5 and IAS19 pension asset<br />
wipe-out, pro-forma Equity would stand at c EUR 100m and net debt would<br />
convert to net cash of EUR 540m.<br />
Conclusion & Action: Buy, target 5.85 for the fundamental value of conglomerate<br />
cash flows.<br />
120<br />
100<br />
(17)<br />
(28)<br />
75<br />
(2)<br />
30<br />
89<br />
59<br />
(21)<br />
(43)<br />
25<br />
4<br />
33<br />
70<br />
37<br />
(15)<br />
(34)<br />
21<br />
695<br />
166<br />
377<br />
65<br />
(138)<br />
1,165<br />
109<br />
25<br />
4<br />
9<br />
147<br />
138<br />
(15)<br />
(33)<br />
99<br />
579<br />
161<br />
391<br />
62<br />
(132)<br />
1,061<br />
52<br />
22<br />
5<br />
44<br />
123<br />
79<br />
(22)<br />
(52)<br />
49