
Create successful ePaper yourself
Turn your PDF publications into a flip-book with our unique Google optimized e-Paper software.
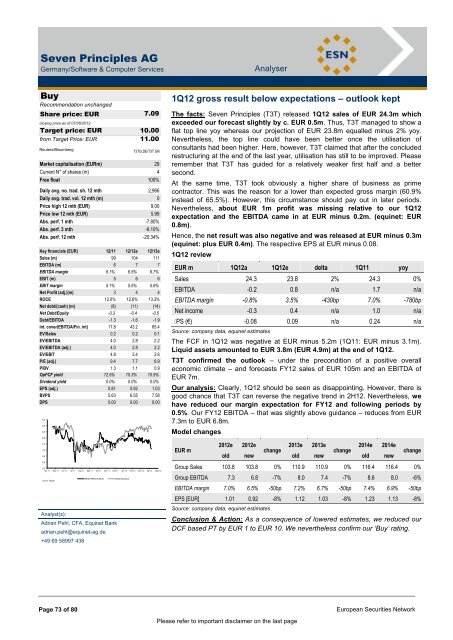
Seven Principles <strong>AG</strong><br />
Germany/Software & Computer Services Analyser<br />
$nomcompagnie$ (Buy)<br />
Buy<br />
Recommendation unchanged<br />
Share price: EUR<br />
closing price as of 07/05/2012<br />
Target price: EUR<br />
from Target Price: EUR<br />
Reuters/Bloomberg<br />
7.09<br />
10.00<br />
11.00<br />
T3TG.DE/T3T GR<br />
Market capitalisation (EURm) 29<br />
Current N° of shares (m) 4<br />
Free float 100%<br />
Daily avg. no. trad. sh. 12 mth 2,966<br />
Daily avg. trad. vol. 12 mth (m) 0<br />
Price high 12 mth (EUR) 9.00<br />
Price low 12 mth (EUR) 5.99<br />
Abs. perf. 1 mth -7.80%<br />
Abs. perf. 3 mth -9.10%<br />
Abs. perf. 12 mth -20.34%<br />
Key financials (EUR) 12/11 12/12e 12/13e<br />
Sales (m) 99 104 111<br />
EBITDA (m) 6 7 7<br />
EBITDA margin 6.1% 6.5% 6.7%<br />
EBIT (m) 5 6 6<br />
EBIT margin 5.1% 5.5% 5.6%<br />
Net Profit (adj.)(m) 3 4 4<br />
ROCE 12.0% 12.6% 13.3%<br />
Net debt/(cash) (m) (8) (11) (14)<br />
Net Debt/Equity -0.3 -0.4 -0.5<br />
Debt/EBITDA -1.3 -1.6 -1.9<br />
Int. cover(EBITDA/Fin. int) 17.8 43.2 65.4<br />
EV/Sales 0.2 0.2 0.1<br />
EV/EBITDA 4.0 2.8 2.2<br />
EV/EBITDA (adj.) 4.0 2.8 2.2<br />
EV/EBIT 4.8 3.4 2.6<br />
P/E (adj.) 9.4 7.7 6.9<br />
P/BV 1.3 1.1 0.9<br />
OpFCF yield 12.5% 10.3% 10.5%<br />
Dividend yield 0.0% 0.0% 0.0%<br />
EPS (adj.) 0.81 0.92 1.03<br />
BVPS 5.63 6.55 7.58<br />
DPS 0.00 0.00 0.00<br />
9.5 vvdsvdvsdy<br />
9.0<br />
8.5<br />
8.0<br />
7.5<br />
7.0<br />
6.5<br />
6.0<br />
5.5<br />
Apr 11 May 11 Jun 11 Jul 11 Aug 11 Sep 11 Oct 11 Nov 11 Dec 11 Jan 12 Feb 12 Mar 12 Apr 12 May 12<br />
Source: Factset<br />
Shareholders:<br />
Analyst(s):<br />
SEVEN PRINCIPLES <strong>AG</strong> MDAX (Rebased)<br />
Adrian Pehl, CFA, Equinet Bank<br />
adrian.pehl@equinet-ag.de<br />
+49 69 58997 438<br />
1Q12 gross result below expectations – outlook kept<br />
The facts: Seven Principles (T3T) released 1Q12 sales of EUR 24.3m which<br />
exceeded our forecast slightly by c. EUR 0.5m. Thus, T3T managed to show a<br />
flat top line yoy whereas our projection of EUR 23.8m equalled minus 2% yoy.<br />
Nevertheless, the top line could have been better once the utilisation of<br />
consultants had been higher. Here, however, T3T claimed that after the concluded<br />
restructuring at the end of the last year, utilisation has still to be improved. Please<br />
remember that T3T has guided for a relatively weaker first half and a better<br />
second.<br />
At the same time, T3T took obviously a higher share of business as prime<br />
contractor. This was the reason for a lower than expected gross margin (60.9%<br />
instead of 65.5%). However, this circumstance should pay out in later periods.<br />
Nevertheless, about EUR 1m profit was missing relative to our 1Q12<br />
expectation and the EBITDA came in at EUR minus 0.2m. (equinet: EUR<br />
0.8m).<br />
Hence, the net result was also negative and was released at EUR minus 0.3m<br />
(equinet: plus EUR 0.4m). The respective EPS at EUR minus 0.08.<br />
1Q12 review<br />
EUR m 1Q12a 1Q12e delta 1Q11 yoy<br />
Sales 24.3 23.8 2% 24.3 0%<br />
EBITDA -0.2 0.8 n/a 1.7 n/a<br />
EBITDA margin -0.8% 3.5% -430bp 7.0% -780bp<br />
Net income -0.3 0.4 n/a 1.0 n/a<br />
PS (€) -0.08 0.09 n/a 0.24 n/a<br />
Source: company data, equinet estimates<br />
The FCF in 1Q12 was negative at EUR minus 5.2m (1Q11: EUR minus 3.1m).<br />
Liquid assets amounted to EUR 3.8m (EUR 4.9m) at the end of 1Q12.<br />
T3T confirmed the outlook – under the precondition of a positive overall<br />
economic climate – and forecasts FY12 sales of EUR 105m and an EBITDA of<br />
EUR 7m.<br />
Our analysis: Clearly, 1Q12 should be seen as disappointing. However, there is<br />
good chance that T3T can reverse the negative trend in 2H12. Nevertheless, we<br />
have reduced our margin expectation for FY12 and following periods by<br />
0.5%. Our FY12 EBITDA – that was slightly above guidance – reduces from EUR<br />
7.3m to EUR 6.8m.<br />
Model changes<br />
EUR m<br />
2012e<br />
old<br />
Page 73 of 80 European Securities Network<br />
2012e<br />
new<br />
change<br />
2013e<br />
Please refer to important disclaimer on the last page<br />
old<br />
2013e<br />
new<br />
change<br />
2014e<br />
old<br />
2014e<br />
new<br />
change<br />
Group Sales 103.8 103.8 0% 110.9 110.9 0% 116.4 116.4 0%<br />
Group EBITDA 7.3 6.8 -7% 8.0 7.4 -7% 8.6 8.0 -6%<br />
EBITDA margin 7.0% 6.5% -50bp 7.2% 6.7% -50bp 7.4% 6.9% -50bp<br />
EPS [EUR] 1.01 0.92 -8% 1.12 1.03 -8% 1.23 1.13 -8%<br />
Source: company data, equinet estimates<br />
Conclusion & Action: As a consequence of lowered estimates, we reduced our<br />
DCF based PT by EUR 1 to EUR 10. We nevertheless confirm our „Buy‟ rating.