

GUIDE WAVE ANALYSIS AND FORECASTING - WMO
GUIDE WAVE ANALYSIS AND FORECASTING - WMO
GUIDE WAVE ANALYSIS AND FORECASTING - WMO

You also want an ePaper? Increase the reach of your titles
YUMPU automatically turns print PDFs into web optimized ePapers that Google loves.
a Directional Waverider (Barstow et al., 1994(a)), and<br />
of which there are about 25–30 operational worldwide.<br />
In the USA, NOAA operates a number of directional<br />
buoys in its extensive measurement network, including<br />
large 6–20 m heave/pitch/roll buoys and a smaller 3 m<br />
system operated closer to the coast. The large buoys<br />
from which the UKOOA (United Kingdom Offshore<br />
Operators Association) acquired directional wave data<br />
also used the heave/pitch/roll system. For further information<br />
on systems presently in use refer to Hamilton<br />
(1990, presently under revision) and <strong>WMO</strong> (1985,<br />
1991, 1994(a)). For more on analysis of these data see<br />
Section 8.7.2.<br />
8.4.2.2 Arrays of wave recorders<br />
Arrays of recorders can provide directional detail and<br />
have been used in several oceanographic and engineering<br />
studies. The degree of directional resolution depends<br />
on the number of wave recorders and their spacing. The<br />
types of instruments which can be used include wave<br />
staffs (Donelan et al., 1985) and pressure transducers<br />
(O’Reilly et al., 1995). Wave directional information<br />
collected from such systems are usually site specific as<br />
the recorded waves are influenced by refraction and<br />
dissipation in shallow water. The arrays can be either<br />
mounted on an offshore platform or bottom mounted in<br />
shallow water if the depth does not exceed 10–15 m.<br />
Similarly, pressure transducer arrays on offshore platforms<br />
should not be located deeper than 10–15 m below<br />
the surface because of depth attenuation of the surface<br />
wave signature.<br />
8.4.2.3 Current meters<br />
Ultrasonic or electromagnetic current meters which<br />
measure the two horizontal components of wave orbital<br />
velocity in conjunction with a pressure recorder or wave<br />
staff can provide useful directional information. These<br />
systems are usually deployed in shallow water but can<br />
also be mounted on offshore platforms, provided the<br />
influence of the platform is not too great. These systems<br />
are directly analogous to the Directional Waverider or<br />
pitch/roll buoy system discussed in Section 8.4.2.1.<br />
Perhaps the most well-known, self-contained instrument<br />
of this type is the “S4” current meter. Also commonly<br />
used is the “UCM-40” current meter.<br />
8.5 Remote sensing from large distances<br />
In general, conventional wave recorders measure the<br />
displacement with respect to time of the water surface at<br />
a fixed point. Remote-sensing techniques (E. D. R.<br />
Shearman, 1983) are not able to measure in this way.<br />
Instead they interrogate an area or footprint which, in the<br />
case of satellite-borne sensors, has typical dimensions of<br />
several kilometres (except synthetic aperture radar,<br />
which can have a footprint of a few tens of metres) and<br />
report some measure of the average wave conditions<br />
over the whole area. Surface-based radars also can have<br />
a range resolution of a few metres, smaller than the<br />
<strong>WAVE</strong> DATA: OBSERVED, MEASURED <strong>AND</strong> HINDCAST 93<br />
wavelengths of the gravity waves being measured,<br />
although the footprint is still broad in azimuth. In consequence,<br />
low-resolution sensors are rarely used for<br />
coastal or shallow water sites, because the wave field<br />
there can vary considerably over distances of much less<br />
than one kilometre. The strength of remote sensing is<br />
that equipment can usually be kept in a safe place well<br />
away from the ravages of the sea and be readily accessible<br />
for maintenance and testing.<br />
The satellite is the most spectacular mounting for a<br />
sea-wave sensor. It is an extremely powerful tool<br />
and can obtain vast quantities of oceanic wave data<br />
worldwide.<br />
Wave measurements made using remote sensing<br />
generally use active microwave sensors (radar), which<br />
send out electromagnetic waves. Deductions about wave<br />
conditions are made from the return signal. Before<br />
considering individual sensors, some features of the<br />
interaction between electromagnetic waves and the sea<br />
surface will be discussed.<br />
8.5.1 Active sensing of the ocean surface with<br />
electromagnetic waves<br />
If we consider a radar sending energy directly down<br />
towards a level, glassy, calm sea surface, the energy will<br />
be reflected from a small region directly below the radar<br />
as if from a mirror. If now the surface is perturbed by<br />
waves, a number of specular reflections (glints) will<br />
arise from facets within the radar beam and perpendicular<br />
to it — essentially from horizontal facets for a<br />
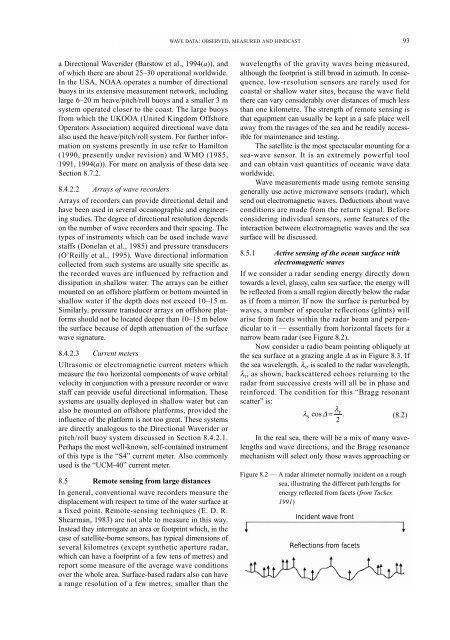
narrow beam radar (see Figure 8.2).<br />
Now consider a radio beam pointing obliquely at<br />
the sea surface at a grazing angle ∆ as in Figure 8.3. If<br />
the sea wavelength, λs, is scaled to the radar wavelength,<br />
λr, as shown, backscattered echoes returning to the<br />
radar from successive crests will all be in phase and<br />
reinforced. The condition for this “Bragg resonant<br />
scatter” is:<br />
λr<br />
λs<br />
cos ∆ = .<br />
(8.2)<br />
2<br />
In the real sea, there will be a mix of many wavelengths<br />
and wave directions, and the Bragg resonance<br />
mechanism will select only those waves approaching or<br />
Figure 8.2 — A radar altimeter normally incident on a rough<br />
sea, illustrating the different path lengths for<br />
energy reflected from facets (from Tucker,<br />
1991)<br />
Incident wave front<br />
Reflections from facets


