

GUIDE WAVE ANALYSIS AND FORECASTING - WMO
GUIDE WAVE ANALYSIS AND FORECASTING - WMO
GUIDE WAVE ANALYSIS AND FORECASTING - WMO

You also want an ePaper? Increase the reach of your titles
YUMPU automatically turns print PDFs into web optimized ePapers that Google loves.
94<br />
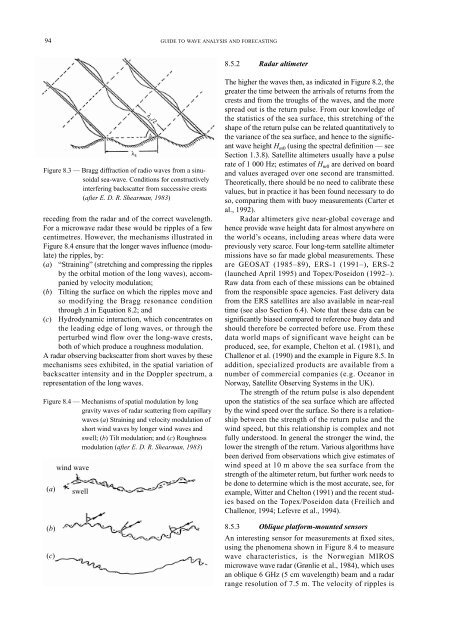
Figure 8.3 — Bragg diffraction of radio waves from a sinusoidal<br />
sea-wave. Conditions for constructively<br />
interfering backscatter from successive crests<br />
(after E. D. R. Shearman, 1983)<br />
receding from the radar and of the correct wavelength.<br />
For a microwave radar these would be ripples of a few<br />
centimetres. However, the mechanisms illustrated in<br />
Figure 8.4 ensure that the longer waves influence (modulate)<br />
the ripples, by:<br />
(a) “Straining” (stretching and compressing the ripples<br />
by the orbital motion of the long waves), accompanied<br />
by velocity modulation;<br />
(b) Tilting the surface on which the ripples move and<br />
so modifying the Bragg resonance condition<br />
through ∆ in Equation 8.2; and<br />
(c) Hydrodynamic interaction, which concentrates on<br />
the leading edge of long waves, or through the<br />
perturbed wind flow over the long-wave crests,<br />
both of which produce a roughness modulation.<br />
A radar observing backscatter from short waves by these<br />
mechanisms sees exhibited, in the spatial variation of<br />
backscatter intensity and in the Doppler spectrum, a<br />
representation of the long waves.<br />
Figure 8.4 — Mechanisms of spatial modulation by long<br />
gravity waves of radar scattering from capillary<br />
waves (a) Straining and velocity modulation of<br />
short wind waves by longer wind waves and<br />
swell; (b) Tilt modulation; and (c) Roughness<br />
modulation (after E. D. R. Shearman, 1983)<br />
(a)<br />
(b)<br />
(c)<br />
wind wave<br />
swell<br />
λ s<br />
λ r /2<br />
∆<br />
<strong>GUIDE</strong> TO <strong>WAVE</strong> <strong>ANALYSIS</strong> <strong>AND</strong> <strong>FORECASTING</strong><br />
8.5.2 Radar altimeter<br />
The higher the waves then, as indicated in Figure 8.2, the<br />
greater the time between the arrivals of returns from the<br />
crests and from the troughs of the waves, and the more<br />
spread out is the return pulse. From our knowledge of<br />
the statistics of the sea surface, this stretching of the<br />
shape of the return pulse can be related quantitatively to<br />
the variance of the sea surface, and hence to the significant<br />
wave height H m0 (using the spectral definition — see<br />
Section 1.3.8). Satellite altimeters usually have a pulse<br />
rate of 1 000 Hz; estimates of H m0 are derived on board<br />
and values averaged over one second are transmitted.<br />
Theoretically, there should be no need to calibrate these<br />
values, but in practice it has been found necessary to do<br />
so, comparing them with buoy measurements (Carter et<br />
al., 1992).<br />
Radar altimeters give near-global coverage and<br />
hence provide wave height data for almost anywhere on<br />
the world’s oceans, including areas where data were<br />
previously very scarce. Four long-term satellite altimeter<br />
missions have so far made global measurements. These<br />
are GEOSAT (1985–89), ERS-1 (1991–), ERS-2<br />
(launched April 1995) and Topex/Poseidon (1992–).<br />
Raw data from each of these missions can be obtained<br />
from the responsible space agencies. Fast delivery data<br />
from the ERS satellites are also available in near-real<br />
time (see also Section 6.4). Note that these data can be<br />
significantly biased compared to reference buoy data and<br />
should therefore be corrected before use. From these<br />
data world maps of significant wave height can be<br />
produced, see, for example, Chelton et al. (1981), and<br />
Challenor et al. (1990) and the example in Figure 8.5. In<br />
addition, specialized products are available from a<br />
number of commercial companies (e.g. Oceanor in<br />
Norway, Satellite Observing Systems in the UK).<br />
The strength of the return pulse is also dependent<br />
upon the statistics of the sea surface which are affected<br />
by the wind speed over the surface. So there is a relationship<br />
between the strength of the return pulse and the<br />
wind speed, but this relationship is complex and not<br />
fully understood. In general the stronger the wind, the<br />
lower the strength of the return. Various algorithms have<br />
been derived from observations which give estimates of<br />
wind speed at 10 m above the sea surface from the<br />
strength of the altimeter return, but further work needs to<br />
be done to determine which is the most accurate, see, for<br />
example, Witter and Chelton (1991) and the recent studies<br />
based on the Topex/Poseidon data (Freilich and<br />
Challenor, 1994; Lefevre et al., 1994).<br />
8.5.3 Oblique platform-mounted sensors<br />
An interesting sensor for measurements at fixed sites,<br />
using the phenomena shown in Figure 8.4 to measure<br />
wave characteristics, is the Norwegian MIROS<br />
microwave wave radar (Grønlie et al., 1984), which uses<br />
an oblique 6 GHz (5 cm wavelength) beam and a radar<br />
range resolution of 7.5 m. The velocity of ripples is


