

GUIDE WAVE ANALYSIS AND FORECASTING - WMO
GUIDE WAVE ANALYSIS AND FORECASTING - WMO
GUIDE WAVE ANALYSIS AND FORECASTING - WMO

You also want an ePaper? Increase the reach of your titles
YUMPU automatically turns print PDFs into web optimized ePapers that Google loves.
98<br />
Range in km<br />
67.5<br />
60.0<br />
52.5<br />
45.0<br />
37.5<br />
30.0<br />
22.5<br />
15.0<br />
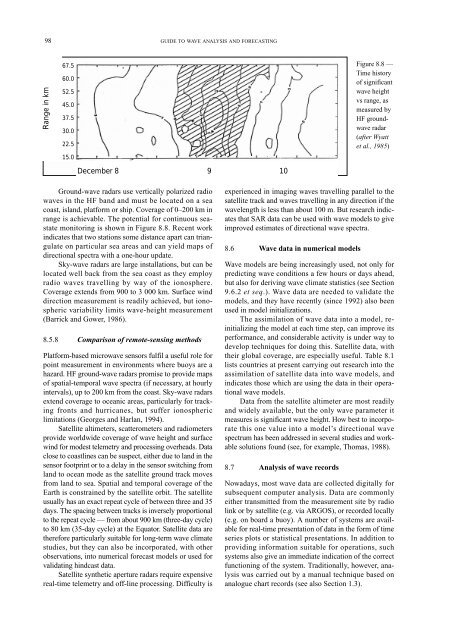
Ground-wave radars use vertically polarized radio<br />
waves in the HF band and must be located on a sea<br />
coast, island, platform or ship. Coverage of 0–200 km in<br />
range is achievable. The potential for continuous seastate<br />
monitoring is shown in Figure 8.8. Recent work<br />
indicates that two stations some distance apart can triangulate<br />
on particular sea areas and can yield maps of<br />
directional spectra with a one-hour update.<br />
Sky-wave radars are large installations, but can be<br />
located well back from the sea coast as they employ<br />
radio waves travelling by way of the ionosphere.<br />
Coverage extends from 900 to 3 000 km. Surface wind<br />
direction measurement is readily achieved, but ionospheric<br />
variability limits wave-height measurement<br />
(Barrick and Gower, 1986).<br />
8.5.8 Comparison of remote-sensing methods<br />
Platform-based microwave sensors fulfil a useful role for<br />
point measurement in environments where buoys are a<br />
hazard. HF ground-wave radars promise to provide maps<br />
of spatial-temporal wave spectra (if necessary, at hourly<br />
intervals), up to 200 km from the coast. Sky-wave radars<br />
extend coverage to oceanic areas, particularly for tracking<br />
fronts and hurricanes, but suffer ionospheric<br />
limitations (Georges and Harlan, 1994).<br />
Satellite altimeters, scatterometers and radiometers<br />
provide worldwide coverage of wave height and surface<br />
wind for modest telemetry and processing overheads. Data<br />
close to coastlines can be suspect, either due to land in the<br />
sensor footprint or to a delay in the sensor switching from<br />
land to ocean mode as the satellite ground track moves<br />
from land to sea. Spatial and temporal coverage of the<br />
Earth is constrained by the satellite orbit. The satellite<br />
usually has an exact repeat cycle of between three and 35<br />
days. The spacing between tracks is inversely proportional<br />
to the repeat cycle — from about 900 km (three-day cycle)<br />
to 80 km (35-day cycle) at the Equator. Satellite data are<br />
therefore particularly suitable for long-term wave climate<br />
studies, but they can also be incorporated, with other<br />
observations, into numerical forecast models or used for<br />
validating hindcast data.<br />
Satellite synthetic aperture radars require expensive<br />
real-time telemetry and off-line processing. Difficulty is<br />
<strong>GUIDE</strong> TO <strong>WAVE</strong> <strong>ANALYSIS</strong> <strong>AND</strong> <strong>FORECASTING</strong><br />
December 8 9 10<br />
experienced in imaging waves travelling parallel to the<br />
satellite track and waves travelling in any direction if the<br />
wavelength is less than about 100 m. But research indicates<br />
that SAR data can be used with wave models to give<br />
improved estimates of directional wave spectra.<br />
8.6 Wave data in numerical models<br />
Wave models are being increasingly used, not only for<br />
predicting wave conditions a few hours or days ahead,<br />
but also for deriving wave climate statistics (see Section<br />
9.6.2 et seq.). Wave data are needed to validate the<br />
models, and they have recently (since 1992) also been<br />
used in model initializations.<br />
The assimilation of wave data into a model, reinitializing<br />
the model at each time step, can improve its<br />
performance, and considerable activity is under way to<br />
develop techniques for doing this. Satellite data, with<br />
their global coverage, are especially useful. Table 8.1<br />
lists countries at present carrying out research into the<br />
assimilation of satellite data into wave models, and<br />
indicates those which are using the data in their operational<br />
wave models.<br />
Data from the satellite altimeter are most readily<br />
and widely available, but the only wave parameter it<br />
measures is significant wave height. How best to incorporate<br />
this one value into a model’s directional wave<br />
spectrum has been addressed in several studies and workable<br />
solutions found (see, for example, Thomas, 1988).<br />
8.7 Analysis of wave records<br />
Figure 8.8 —<br />
Time history<br />
of significant<br />
wave height<br />
vs range, as<br />
measured by<br />
HF groundwave<br />
radar<br />
(after Wyatt<br />
et al., 1985)<br />
Nowadays, most wave data are collected digitally for<br />
subsequent computer analysis. Data are commonly<br />
either transmitted from the measurement site by radio<br />
link or by satellite (e.g. via ARGOS), or recorded locally<br />
(e.g. on board a buoy). A number of systems are available<br />
for real-time presentation of data in the form of time<br />
series plots or statistical presentations. In addition to<br />
providing information suitable for operations, such<br />
systems also give an immediate indication of the correct<br />
functioning of the system. Traditionally, however, analysis<br />
was carried out by a manual technique based on<br />
analogue chart records (see also Section 1.3).


