

GUIDE WAVE ANALYSIS AND FORECASTING - WMO
GUIDE WAVE ANALYSIS AND FORECASTING - WMO
GUIDE WAVE ANALYSIS AND FORECASTING - WMO

You also want an ePaper? Increase the reach of your titles
YUMPU automatically turns print PDFs into web optimized ePapers that Google loves.
The descriptions of wind effects on the sea surface<br />
which are used by mariners for observing the various<br />
intensities of the wind have not been chosen arbitrarily.<br />
The criteria are the result of long experience and represent<br />
individually distinguishable steps on a specific<br />
scale. Originally, these steps were characterized by<br />
descriptive terms, such as light breeze and moderate<br />
breeze, or gale and strong gale. When, in the last<br />
century, weather reporting became an operational practice,<br />
the steps were given numbers, and the wind scale<br />
was named after Admiral Beaufort who introduced this<br />
coding system in 1814 in the British navy. The<br />
Beaufort scale was recommended for international use<br />
in 1874.<br />
Since it is possible for an experienced observer to<br />
distinguish one step from another, a wind observation<br />
should be accurate to within a half of one scale interval<br />
— a fact which has indeed been verified empirically.<br />
However, wind effects on the sea surface are sometimes<br />
modified by other phenomena, of which the observer<br />
may be unaware. The plankton content of the sea water<br />
has an influence on foam forming, air stability affects<br />
the steepness of waves to some extent, while strong<br />
currents may also change the form of waves and hence<br />
the general appearance of the sea state. As a result, the<br />
standard deviation of a wind observation is, on the average,<br />
somewhat greater than a half of one scale interval: it<br />
amounts to 0.58 I (I being the width of the scale interval)<br />
for each of the steps 1–10 of the Beaufort scale. This<br />
means that the standard deviation of an individual<br />
wind-speed observation varies from 0.76 m/s at step 1<br />
(wind speed 2.0 m/s) to 1.34 m/s at step 5 (wind speed<br />
10.2 m/s) and 2.6 m/s at step 10 (wind speed 24.2 m/s)<br />
(Verploegh, 1967).<br />
It should be stressed that wave height is not a criterion<br />
used in wind observations at sea. Any mariner is<br />
all too well aware that wave height depends on other<br />
factors as well — such as the duration and fetch of the<br />
wind. The influence of fetch, for instance, is clearly<br />
noticeable when the ship is in the lee of land, or when<br />
there are abrupt wind changes in open seas.<br />
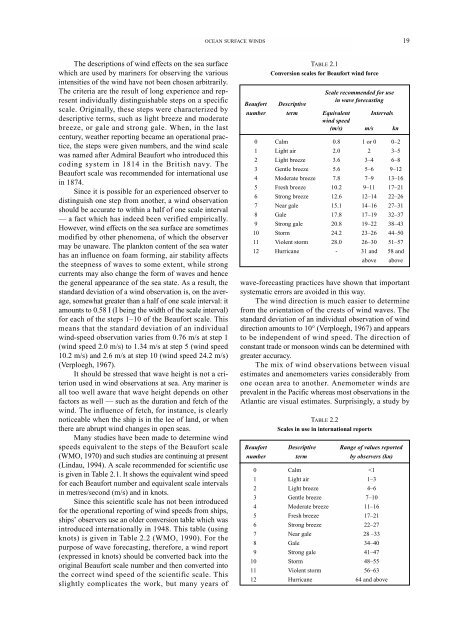
Many studies have been made to determine wind<br />
speeds equivalent to the steps of the Beaufort scale<br />
(<strong>WMO</strong>, 1970) and such studies are continuing at present<br />
(Lindau, 1994). A scale recommended for scientific use<br />
is given in Table 2.1. It shows the equivalent wind speed<br />
for each Beaufort number and equivalent scale intervals<br />
in metres/second (m/s) and in knots.<br />
Since this scientific scale has not been introduced<br />
for the operational reporting of wind speeds from ships,<br />
ships’ observers use an older conversion table which was<br />
introduced internationally in 1948. This table (using<br />
knots) is given in Table 2.2 (<strong>WMO</strong>, 1990). For the<br />
purpose of wave forecasting, therefore, a wind report<br />
(expressed in knots) should be converted back into the<br />
original Beaufort scale number and then converted into<br />
the correct wind speed of the scientific scale. This<br />
slightly complicates the work, but many years of<br />
OCEAN SURFACE WINDS 19<br />
TABLE 2.1<br />
Conversion scales for Beaufort wind force<br />
Beaufort Descriptive<br />
Scale recommended for use<br />
in wave forecasting<br />
number term Equivalent<br />
wind speed<br />
Intervals<br />
(m/s) m/s kn<br />
0 Calm 0.8 1 or 0 0–2<br />
1 Light air 2.0 2 3–5<br />
2 Light breeze 3.6 3–4 6–8<br />
3 Gentle breeze 5.6 5–6 9–12<br />
4 Moderate breeze 7.8 7–9 13–16<br />
5 Fresh breeze 10.2 9–11 17–21<br />
6 Strong breeze 12.6 12–14 22–26<br />
7 Near gale 15.1 14–16 27–31<br />
8 Gale 17.8 17–19 32–37<br />
9 Strong gale 20.8 19–22 38–43<br />
10 Storm 24.2 23–26 44–50<br />
11 Violent storm 28.0 26–30 51–57<br />
12 Hurricane - 31 and 58 and<br />
above above<br />
wave-forecasting practices have shown that important<br />
systematic errors are avoided in this way.<br />
The wind direction is much easier to determine<br />
from the orientation of the crests of wind waves. The<br />
standard deviation of an individual observation of wind<br />
direction amounts to 10° (Verploegh, 1967) and appears<br />
to be independent of wind speed. The direction of<br />
constant trade or monsoon winds can be determined with<br />
greater accuracy.<br />
The mix of wind observations between visual<br />
estimates and anemometers varies considerably from<br />
one ocean area to another. Anemometer winds are<br />
prevalent in the Pacific whereas most observations in the<br />
Atlantic are visual estimates. Surprisingly, a study by<br />
TABLE 2.2<br />
Scales in use in international reports<br />
Beaufort Descriptive Range of values reported<br />
number term by observers (kn)<br />
0 Calm


