- Page 1 and 2:
WORLD METEOROLOGICAL ORGANIZATION G
- Page 3 and 4:
© 1998, World Meteorological Organ
- Page 5 and 6:
IV Chapter 7 - WAVES IN SHALLOW WAT
- Page 7 and 8:
ACKNOWLEDGEMENTS The revision of th
- Page 9 and 10:
VIII has been included particularly
- Page 11 and 12:
X considerable attention. Annex III
- Page 13 and 14:
2 η Crest Zero level a H = 2a a Tr
- Page 15 and 16:
4 Figure 1.5 — Paths of the water
- Page 17 and 18:
6 When waves propagate into shallow
- Page 19 and 20:
8 1.3.2 Wave groups and group veloc
- Page 21 and 22:
10 wavelengths in a given sea state
- Page 23 and 24:
12 for instance, a frequency of 0.1
- Page 25 and 26:
14 in which E(f) is the variance de
- Page 27 and 28:
16 2.1.1 Wind and pressure analyses
- Page 29 and 30: 18 GUIDE TO WAVE ANALYSIS AND FOREC
- Page 31 and 32: 20 Figure 2.2(a) (right) — Usual
- Page 33 and 34: 22 As a quick approximation of ocea
- Page 35 and 36: 24 GUIDE TO WAVE ANALYSIS AND FOREC
- Page 37 and 38: 26 Gr G Gr ∇p C Cnf ∇p C Cnf
- Page 39 and 40: 28 POINT C — The effect of warm a
- Page 41 and 42: 30 a general sense, and can be appl
- Page 43 and 44: 32 Free atmosphere Ekman layer Cons
- Page 45 and 46: 3.1 Introduction This chapter gives
- Page 47 and 48: ange of directions. Also, waves at
- Page 49 and 50: small enough that swell can survive
- Page 51 and 52: Figure 3.7 — Structure of spectra
- Page 53 and 54: 4.1 Introduction CHAPTER 4 WAVE FOR
- Page 55 and 56: necessary to forecast waves for a p
- Page 57 and 58: TABLE 4.4 Additional wave informati
- Page 59 and 60: TABLE 4.6 Ranges of swell periods a
- Page 61 and 62: this situation, the angular spreadi
- Page 63 and 64: the energy flux is c gH 2 . This is
- Page 65 and 66: α0, degrees Solution: 80° 70° 60
- Page 67 and 68: 5.1 Introduction National Meteorolo
- Page 69 and 70: only once, since it is usual to sto
- Page 71 and 72: Frequency 0.050 0.067 0.083 0.100 0
- Page 73 and 74: The models may differ in several re
- Page 75 and 76: The CH class may include many semi-
- Page 77 and 78: 6.1 Introductory remarks Since the
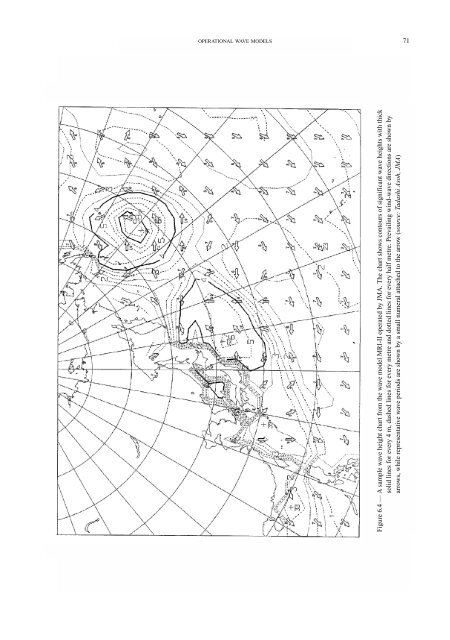
- Page 79: in some applications, the zero up/d
- Page 83 and 84: give large differences in the compa
- Page 85 and 86: Wind (m/s) Waves (m) Buoy/GSOWM Wav
- Page 87 and 88: TABLE 6.2 Numerical wave models ope
- Page 89 and 90: TABLE 6.2 (cont.) Country Name of m
- Page 91 and 92: 7.1 Introduction The evolution of w
- Page 93 and 94: water boundary into shallow water.
- Page 95 and 96: eflected waves, although the latter
- Page 97 and 98: Energy (cm 2 /Hz) Energy (cm 2 /Hz)
- Page 99 and 100: 8.1 Introduction Wave data are ofte
- Page 101 and 102: matter and timing the intervals bet
- Page 103 and 104: a Directional Waverider (Barstow et
- Page 105 and 106: 80°N 60°N 40°N 20°N 0° -20°S
- Page 107 and 108: a combination of sea-surface temper
- Page 109 and 110: 8.7.1 Digital analysis of wave reco
- Page 111 and 112: 9.1 Introduction Chapter 8 describe
- Page 113 and 114: Presentation of data and wave clima
- Page 115 and 116: the monsoon season of June to Septe
- Page 117 and 118: Probability of non-exceedance case
- Page 119 and 120: individual wave height derived usin
- Page 121 and 122: emote, data-sparse areas. However,
- Page 123 and 124: TABLE 9.2 (cont.) Country Source of
- Page 125 and 126: For a storm hindcast, select the mo
- Page 127 and 128: TABLE 9.3 (cont.) Country Model use
- Page 129 and 130: ANNEX I ABBREVIATIONS AND KEY TO SY
- Page 131 and 132:
Abbreviation/ Definition Symbol MOS
- Page 133 and 134:
CODE FORM: D . . . . D or IIiii* SE
- Page 135 and 136:
sensors, spectral peak wave period
- Page 137 and 138:
cs1cs1 The ratio of the spectral de
- Page 139 and 140:
M jM j n mn m n smn sm n bn bn b P
- Page 141 and 142:
1744 Im Indicator for method of cal
- Page 143 and 144:
The following distributions are bri
- Page 145 and 146:
4. Weibull distribution Probability
- Page 147 and 148:
8. Fisher-Tippett Type I (FT-I) (or
- Page 149 and 150:
ANNEX IV THE PNJ (PIERSON-NEUMANN-J
- Page 151 and 152:
ANNEX IV 141 Duration graph. Distor
- Page 153 and 154:
REFERENCES Abbott, M. B., H. H. Pet
- Page 155 and 156:
REFERENCES 145 Carter, D. J. T., P.
- Page 157 and 158:
REFERENCES 147 Gumbel, E. J., 1958:
- Page 159 and 160:
REFERENCES 149 Maat, N., C. Kraan a
- Page 161 and 162:
Slutz, R. J., S. J. Lubker, J. D. H
- Page 163 and 164:
SELECTED BIBLIOGRAPHY CERC, 1984: C
- Page 165 and 166:
156 Energy . . . . . . . . . . . .
- Page 167 and 168:
158 steepness . . . . . . . . . . .


