

GUIDE WAVE ANALYSIS AND FORECASTING - WMO
GUIDE WAVE ANALYSIS AND FORECASTING - WMO
GUIDE WAVE ANALYSIS AND FORECASTING - WMO

You also want an ePaper? Increase the reach of your titles
YUMPU automatically turns print PDFs into web optimized ePapers that Google loves.
2<br />
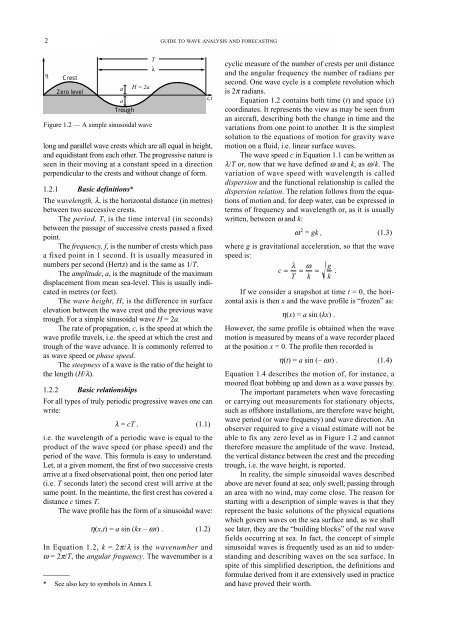
η<br />
Crest<br />
Zero level<br />
a H = 2a<br />
a<br />
Trough<br />
Figure 1.2 — A simple sinusoidal wave<br />
long and parallel wave crests which are all equal in height,<br />
and equidistant from each other. The progressive nature is<br />
seen in their moving at a constant speed in a direction<br />
perpendicular to the crests and without change of form.<br />
1.2.1 Basic definitions*<br />
The wavelength, λ, is the horizontal distance (in metres)<br />
between two successive crests.<br />
The period, T, is the time interval (in seconds)<br />
between the passage of successive crests passed a fixed<br />
point.<br />
The frequency, f, is the number of crests which pass<br />
a fixed point in 1 second. It is usually measured in<br />
numbers per second (Hertz) and is the same as 1/T.<br />
The amplitude, a, is the magnitude of the maximum<br />
displacement from mean sea-level. This is usually indicated<br />
in metres (or feet).<br />
The wave height, H, is the difference in surface<br />
elevation between the wave crest and the previous wave<br />
trough. For a simple sinusoidal wave H = 2a.<br />
The rate of propagation, c, is the speed at which the<br />
wave profile travels, i.e. the speed at which the crest and<br />
trough of the wave advance. It is commonly referred to<br />
as wave speed or phase speed.<br />
The steepness of a wave is the ratio of the height to<br />
the length (H/λ).<br />
1.2.2 Basic relationships<br />
For all types of truly periodic progressive waves one can<br />
write:<br />
λ = cT , (1.1)<br />
i.e. the wavelength of a periodic wave is equal to the<br />
product of the wave speed (or phase speed) and the<br />
period of the wave. This formula is easy to understand.<br />
Let, at a given moment, the first of two successive crests<br />
arrive at a fixed observational point, then one period later<br />
(i.e. T seconds later) the second crest will arrive at the<br />
same point. In the meantime, the first crest has covered a<br />
distance c times T.<br />
The wave profile has the form of a sinusoidal wave:<br />
η(x,t) = a sin (kx – ωt) . (1.2)<br />
In Equation 1.2, k = 2π/λ is the wavenumber and<br />
ω =2π/T, the angular frequency. The wavenumber is a<br />
_______<br />
* See also key to symbols in Annex I.<br />
T<br />
λ<br />
<strong>GUIDE</strong> TO <strong>WAVE</strong> <strong>ANALYSIS</strong> <strong>AND</strong> <strong>FORECASTING</strong><br />
x,t<br />
cyclic measure of the number of crests per unit distance<br />
and the angular frequency the number of radians per<br />
second. One wave cycle is a complete revolution which<br />
is 2π radians.<br />
Equation 1.2 contains both time (t) and space (x)<br />
coordinates. It represents the view as may be seen from<br />
an aircraft, describing both the change in time and the<br />
variations from one point to another. It is the simplest<br />
solution to the equations of motion for gravity wave<br />
motion on a fluid, i.e. linear surface waves.<br />
The wave speed c in Equation 1.1 can be written as<br />
λ/T or, now that we have defined ω and k, as ω/k. The<br />
variation of wave speed with wavelength is called<br />
dispersion and the functional relationship is called the<br />
dispersion relation. The relation follows from the equations<br />
of motion and, for deep water, can be expressed in<br />
terms of frequency and wavelength or, as it is usually<br />
written, between ω and k:<br />
ω 2 = gk , (1.3)<br />
where g is gravitational acceleration, so that the wave<br />
speed is:<br />
λ ω g<br />
c = = = .<br />
T k k<br />
If we consider a snapshot at time t = 0, the horizontal<br />
axis is then x and the wave profile is “frozen” as:<br />
η(x) = a sin (kx) .<br />
However, the same profile is obtained when the wave<br />
motion is measured by means of a wave recorder placed<br />
at the position x = 0. The profile then recorded is<br />
η(t) = a sin (– ωt) . (1.4)<br />
Equation 1.4 describes the motion of, for instance, a<br />
moored float bobbing up and down as a wave passes by.<br />
The important parameters when wave forecasting<br />
or carrying out measurements for stationary objects,<br />
such as offshore installations, are therefore wave height,<br />
wave period (or wave frequency) and wave direction. An<br />
observer required to give a visual estimate will not be<br />
able to fix any zero level as in Figure 1.2 and cannot<br />
therefore measure the amplitude of the wave. Instead,<br />
the vertical distance between the crest and the preceding<br />
trough, i.e. the wave height, is reported.<br />
In reality, the simple sinusoidal waves described<br />
above are never found at sea; only swell, passing through<br />
an area with no wind, may come close. The reason for<br />
starting with a description of simple waves is that they<br />
represent the basic solutions of the physical equations<br />
which govern waves on the sea surface and, as we shall<br />
see later, they are the “building blocks” of the real wave<br />
fields occurring at sea. In fact, the concept of simple<br />
sinusoidal waves is frequently used as an aid to understanding<br />
and describing waves on the sea surface. In<br />
spite of this simplified description, the definitions and<br />
formulae derived from it are extensively used in practice<br />
and have proved their worth.


