

Electronic Material Properties - und Geowissenschaften ...
Electronic Material Properties - und Geowissenschaften ...
Electronic Material Properties - und Geowissenschaften ...

Create successful ePaper yourself
Turn your PDF publications into a flip-book with our unique Google optimized e-Paper software.
Phase diagram of the Pt-Rh alloy studied with a refined<br />
BOS mixing model<br />
Johan Pohl and Karsten Albe<br />
The Pt-Rh alloy is used in automotive exhaust gas converters as a three-way<br />
catalyst. It has attracted much attention from the scientific community due to its<br />
catalytic applications. But although many studies have been performed on the bulk,<br />
surface and nanoparticulate properties of this alloy, some features still remain<br />
puzzling. An answer to the question whether Pt-Rh phase separates or not could only<br />
recently be given. The widely accepted phase diagram, which shows a miscibility gap<br />
and predicts a critical temperature of 1033K, has been constructed by E. Raub [1] in<br />
1959. He inferred from the experimentally confirmed phase separation in Ir-Pt, Ir-Pd<br />
and Pd-Rh, that Pt-Rh would behave similarly. The critical temperature was<br />
estimated from the difference in the melting points of the two constituents. Although<br />
the phase diagram was reprinted many times since, a miscibility gap has never been<br />
observed in experiment. Recent ab-inito density functional theory (DFT) studies [2], in<br />
contrast, provide strong hints that Pt-Rh does not phase separate, but that various<br />
ordered compo<strong>und</strong>s exist at temperatures below 300K. These studies have been<br />
corroborated by experimental results using diffuse X-ray scattering in order to<br />
measure the amount of short-range order present in the alloy at a temperature as<br />
high as 923K [3]. A corrected phase diagram for Pt-Rh, however, that incorporates<br />
the findings of the last 10 years has not been available so far.<br />
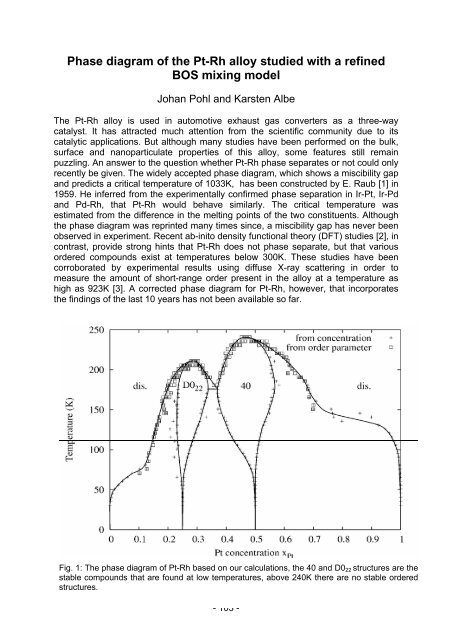
Fig. 1: The phase diagram of Pt-Rh based on our calculations, the 40 and D022 structures are the<br />
stable compo<strong>und</strong>s that are fo<strong>und</strong> at low temperatures, above 240K there are no stable ordered<br />
structures.<br />
- 103 -