

Electronic Material Properties - und Geowissenschaften ...
Electronic Material Properties - und Geowissenschaften ...
Electronic Material Properties - und Geowissenschaften ...

Create successful ePaper yourself
Turn your PDF publications into a flip-book with our unique Google optimized e-Paper software.
The glass transition temperature (Tg) of Cu50Zr50 and Cu47.5Zr47.5Al5 2 mm∅ rods are<br />
estimated to be 671 K and 698 K, respectively. The supercooled liquid region (∆Tx) for<br />
Cu50Zr50 and Cu47.5Zr47.5Al5 is 46 K and 74 K, respectively. This proves that addition of Al<br />
increases the glass-forming ability of binary Cu50Zr50. The resulting Cu47.5Zr47.5Al5 glass<br />
exhibits high strength (2265 MPa) together with a large room temperature ductility of up to<br />
18%, as depicted in Fig. 2. After yielding a strong increase in the flow stress is observed<br />
during deformation indicating a “work-hardening” like behavior.<br />
In recent years, a large number of high strength and ductile Ti-base nanocomposites with<br />
bimodal distribution of micrometer-sized primary bcc β-Ti dendrites / primary FeTi(Co)<br />
phase distributed in a nano-/ultrafine eutectic matrix has been reported. Similar properties<br />
have been achieved by tailoring the eutectic structure without any micrometer-sized<br />
toughening phase. For example, (Ti0.705Fe0.295)100-x Snx (x = 0 and 3.85) ultrafine eutectics<br />
were prepared by slow cooling from the melt through cold crucible casting into 6 mm<br />
diameter rods. The microstructure of both alloys exhibits an eutectic consisting of A2 (β-Ti)<br />
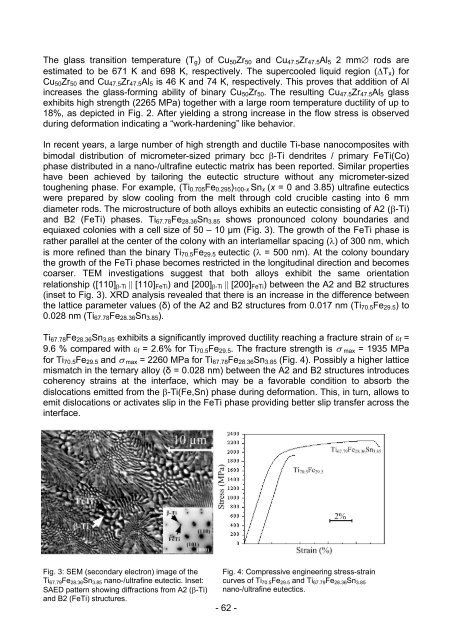
and B2 (FeTi) phases. Ti67.78Fe28.36Sn3.85 shows pronounced colony bo<strong>und</strong>aries and<br />
equiaxed colonies with a cell size of 50 – 10 µm (Fig. 3). The growth of the FeTi phase is<br />
rather parallel at the center of the colony with an interlamellar spacing (λ) of 300 nm, which<br />
is more refined than the binary Ti70.5Fe29.5 eutectic (λ = 500 nm). At the colony bo<strong>und</strong>ary<br />
the growth of the FeTi phase becomes restricted in the longitudinal direction and becomes<br />
coarser. TEM investigations suggest that both alloys exhibit the same orientation<br />
relationship ([110]β-Ti || [110]FeTi) and [200]β-Ti || [200]FeTi) between the A2 and B2 structures<br />
(inset to Fig. 3). XRD analysis revealed that there is an increase in the difference between<br />
the lattice parameter values (δ) of the A2 and B2 structures from 0.017 nm (Ti70.5Fe29.5) to<br />
0.028 nm (Ti67.78Fe28.36Sn3.85).<br />
Ti67.78Fe28.36Sn3.85 exhibits a significantly improved ductility reaching a fracture strain of εf =<br />
9.6 % compared with εf = 2.6% for Ti70.5Fe29.5. The fracture strength is σ max = 1935 MPa<br />
for Ti70.5Fe29.5 and σ max = 2260 MPa for Ti67.78Fe28.36Sn3.85 (Fig. 4). Possibly a higher lattice<br />
mismatch in the ternary alloy (δ = 0.028 nm) between the A2 and B2 structures introduces<br />
coherency strains at the interface, which may be a favorable condition to absorb the<br />
dislocations emitted from the β-Ti(Fe,Sn) phase during deformation. This, in turn, allows to<br />
emit dislocations or activates slip in the FeTi phase providing better slip transfer across the<br />
interface.<br />
Fig. 3: SEM (secondary electron) image of the<br />
Ti67.79Fe28.36Sn3.85 nano-/ultrafine eutectic. Inset:<br />
SAED pattern showing diffractions from A2 (β-Ti)<br />
and B2 (FeTi) structures.<br />
Fig. 4: Compressive engineering stress-strain<br />
curves of Ti70.5Fe29.5 and Ti67.79Fe28.36Sn3.85<br />
nano-/ultrafine eutectics.<br />
- 62 -