

Electronic Material Properties - und Geowissenschaften ...
Electronic Material Properties - und Geowissenschaften ...
Electronic Material Properties - und Geowissenschaften ...

Create successful ePaper yourself
Turn your PDF publications into a flip-book with our unique Google optimized e-Paper software.
In this study, we have therefore determined the Pt-Rh phase diagram by calculating<br />
the grand canonical potential. We applied the thermodynamic integration method<br />
using lattice-based Monte Carlo simulations in the semi-grand canonical ensemble,<br />
where the total number of atoms is fixed, while the difference between the number of<br />
A and B type atoms is allowed to fluctuate for a fixed chemical potential. A<br />
numerically efficient lattice based Hamiltonian was developed by fitting an improved<br />
version of DePristo’s bond-order simulation (BOS) mixing model [4] to a set of input<br />
data obtained from DFT calculations. The calculated the phase diagram of Pt-Rh is<br />
shown in Fig. 1. The phase bo<strong>und</strong>aries are obtained by looking for discontinuities in<br />
the order parameter when integrating down over temperature at constant chemical<br />
potential, and for discontinuities in concentration when integrating over the chemical<br />
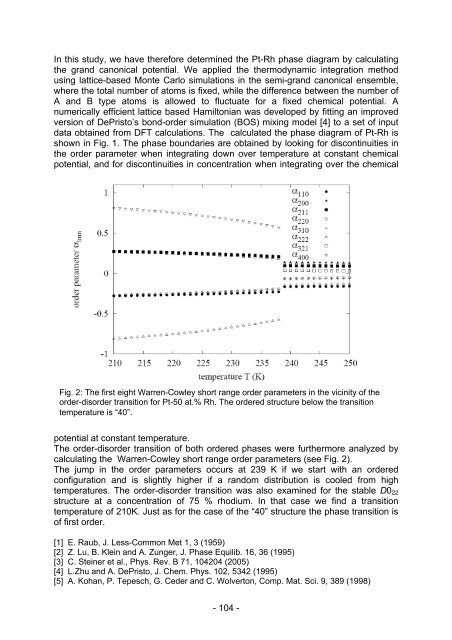
Fig. 2: The first eight Warren-Cowley short range order parameters in the vicinity of the<br />
order-disorder transition for Pt-50 at.% Rh. The ordered structure below the transition<br />
temperature is “40”.<br />
potential at constant temperature.<br />
The order-disorder transition of both ordered phases were furthermore analyzed by<br />
calculating the Warren-Cowley short range order parameters (see Fig. 2).<br />
The jump in the order parameters occurs at 239 K if we start with an ordered<br />
configuration and is slightly higher if a random distribution is cooled from high<br />
temperatures. The order-disorder transition was also examined for the stable D022<br />
structure at a concentration of 75 % rhodium. In that case we find a transition<br />
temperature of 210K. Just as for the case of the “40” structure the phase transition is<br />
of first order.<br />
[1] E. Raub, J. Less-Common Met 1, 3 (1959)<br />
[2] Z. Lu, B. Klein and A. Zunger, J. Phase Equilib. 16, 36 (1995)<br />
[3] C. Steiner et al., Phys. Rev. B 71, 104204 (2005)<br />
[4] L.Zhu and A. DePristo, J. Chem. Phys. 102, 5342 (1995)<br />
[5] A. Kohan, P. Tepesch, G. Ceder and C. Wolverton, Comp. Mat. Sci. 9, 389 (1998)<br />
- 104 -