- Page 3 and 4:
Microbiology SENIOR CONTRIBUTING AU
- Page 5 and 6:
OPENSTAX OpenStax provides free, pe
- Page 7 and 8:
Contents Preface 1 CHAPTER 1 An Inv
- Page 9 and 10:
9.2 Oxygen Requirements for Microbi
- Page 11 and 12:
18.1 Overview of Specific Adaptive
- Page 13 and 14:
Appendix C Metabolic Pathways 1155
- Page 15 and 16:
Preface 1 PREFACE Welcome to Microb
- Page 17 and 18:
Preface 3 that often confer critica
- Page 19 and 20:
Preface 5 further. Our features inc
- Page 21 and 22:
Preface 7 and science, and pursues
- Page 23 and 24:
CHAPTER 1 An Invisible World Figure
- Page 25 and 26:
1.1 • What Our Ancestors Knew 11
- Page 27 and 28:
1.1 • What Our Ancestors Knew 13
- Page 29 and 30:
1.1 • What Our Ancestors Knew 15
- Page 31 and 32:
1.2 • A Systematic Approach 17 Th
- Page 33 and 34:
1.2 • A Systematic Approach 19 Fi
- Page 35 and 36:
1.2 • A Systematic Approach 21 Ta
- Page 37 and 38:
1.3 • Types of Microorganisms 23
- Page 39 and 40:
1.3 • Types of Microorganisms 25
- Page 41 and 42:
1.3 • Types of Microorganisms 27
- Page 43 and 44:
1.3 • Types of Microorganisms 29
- Page 45 and 46:
1 • Summary 31 SUMMARY 1.1 What O
- Page 47 and 48:
1 • Review Questions 33 17. The p
- Page 49 and 50:
CHAPTER 2 How We See the Invisible
- Page 51 and 52:
2.1 • The Properties of Light 37
- Page 53 and 54:
2.1 • The Properties of Light 39
- Page 55 and 56:
2.2 • Peering Into the Invisible
- Page 57 and 58:
2.3 • Instruments of Microscopy 4
- Page 59 and 60:
2.3 • Instruments of Microscopy 4
- Page 61 and 62:
2.3 • Instruments of Microscopy 4
- Page 63 and 64:
2.3 • Instruments of Microscopy 4
- Page 65 and 66:
2.3 • Instruments of Microscopy 5
- Page 67 and 68:
2.3 • Instruments of Microscopy 5
- Page 69 and 70:
2.3 • Instruments of Microscopy 5
- Page 71 and 72:
2.3 • Instruments of Microscopy 5
- Page 73 and 74:
2.4 • Staining Microscopic Specim
- Page 75 and 76:
2.4 • Staining Microscopic Specim
- Page 77 and 78:
2.4 • Staining Microscopic Specim
- Page 79 and 80:
2.4 • Staining Microscopic Specim
- Page 81 and 82:
2.4 • Staining Microscopic Specim
- Page 83 and 84:
2.4 • Staining Microscopic Specim
- Page 85 and 86:
2 • Review Questions 71 REVIEW QU
- Page 87 and 88:
CHAPTER 3 The Cell Figure 3.1 Micro
- Page 89 and 90:
3.1 • Spontaneous Generation 75 F
- Page 91 and 92:
3.2 • Foundations of Modern Cell
- Page 93 and 94:
3.2 • Foundations of Modern Cell
- Page 95 and 96:
3.2 • Foundations of Modern Cell
- Page 97 and 98:
3.2 • Foundations of Modern Cell
- Page 99 and 100:
3.3 • Unique Characteristics of P
- Page 101 and 102:
3.3 • Unique Characteristics of P
- Page 103 and 104:
3.3 • Unique Characteristics of P
- Page 105 and 106:
3.3 • Unique Characteristics of P
- Page 107 and 108:
3.3 • Unique Characteristics of P
- Page 109 and 110:
3.3 • Unique Characteristics of P
- Page 111 and 112:
3.3 • Unique Characteristics of P
- Page 113 and 114:
3.3 • Unique Characteristics of P
- Page 115 and 116:
3.3 • Unique Characteristics of P
- Page 117 and 118:
3.4 • Unique Characteristics of E
- Page 119 and 120:
3.4 • Unique Characteristics of E
- Page 121 and 122:
3.4 • Unique Characteristics of E
- Page 123 and 124:
3.4 • Unique Characteristics of E
- Page 125 and 126:
3.4 • Unique Characteristics of E
- Page 127 and 128:
3.4 • Unique Characteristics of E
- Page 129 and 130:
3.4 • Unique Characteristics of E
- Page 131 and 132:
3.4 • Unique Characteristics of E
- Page 133 and 134:
3.4 • Unique Characteristics of E
- Page 135 and 136:
3.4 • Unique Characteristics of E
- Page 137 and 138:
3.4 • Unique Characteristics of E
- Page 139 and 140:
3 • Summary 125 SUMMARY 3.1 Spont
- Page 141 and 142:
3 • Review Questions 127 3. Which
- Page 143 and 144:
3 • Review Questions 129 Critical
- Page 145 and 146:
CHAPTER 4 Prokaryotic Diversity Fig
- Page 147 and 148:
4.1 • Prokaryote Habitats, Relati
- Page 149 and 150:
4.1 • Prokaryote Habitats, Relati
- Page 151 and 152:
4.1 • Prokaryote Habitats, Relati
- Page 153 and 154:
4.2 • Proteobacteria 139 for or s
- Page 155 and 156:
4.2 • Proteobacteria 141 Class Al
- Page 157 and 158:
4.2 • Proteobacteria 143 Class Be
- Page 159 and 160:
4.2 • Proteobacteria 145 Figure 4
- Page 161 and 162:
4.2 • Proteobacteria 147 Class Ga
- Page 163 and 164:
4.3 • Nonproteobacteria Gram-Nega
- Page 165 and 166:
4.3 • Nonproteobacteria Gram-Nega
- Page 167 and 168:
4.3 • Nonproteobacteria Gram-Nega
- Page 169 and 170:
4.3 • Nonproteobacteria Gram-Nega
- Page 171 and 172:
4.4 • Gram-Positive Bacteria 157
- Page 173 and 174:
4.4 • Gram-Positive Bacteria 159
- Page 175 and 176:
4.4 • Gram-Positive Bacteria 161
- Page 177 and 178:
4.4 • Gram-Positive Bacteria 163
- Page 179 and 180:
4.4 • Gram-Positive Bacteria 165
- Page 181 and 182:
4.6 • Archaea 167 The class Therm
- Page 183 and 184:
4.6 • Archaea 169 thus is a livin
- Page 185 and 186:
4 • Summary 171 SUMMARY 4.1 Proka
- Page 187 and 188:
4 • Review Questions 173 REVIEW Q
- Page 189 and 190:
4 • Review Questions 175 39. Expl
- Page 191 and 192:
CHAPTER 5 The Eukaryotes of Microbi
- Page 193 and 194:
5.1 • Unicellular Eukaryotic Para
- Page 195 and 196:
5.1 • Unicellular Eukaryotic Para
- Page 197 and 198:
Figure 5.7 5.1 • Unicellular Euka
- Page 199 and 200:
5.1 • Unicellular Eukaryotic Para
- Page 201 and 202:
5.1 • Unicellular Eukaryotic Para
- Page 203 and 204:
5.1 • Unicellular Eukaryotic Para
- Page 205 and 206:
5.1 • Unicellular Eukaryotic Para
- Page 207 and 208:
5.2 • Parasitic Helminths 193 hel
- Page 209 and 210:
5.2 • Parasitic Helminths 195 Fig
- Page 211 and 212:
5.2 • Parasitic Helminths 197 Fig
- Page 213 and 214:
5.2 • Parasitic Helminths 199 MIC
- Page 215 and 216:
5.3 • Fungi 201 Figure 5.25 Multi
- Page 217 and 218:
5.3 • Fungi 203 Figure 5.27 zygos
- Page 219 and 220:
5.3 • Fungi 205 diploid stages (F
- Page 221 and 222:
5.3 • Fungi 207 Figure 5.32 prese
- Page 223 and 224:
5.3 • Fungi 209 MICRO CONNECTIONS
- Page 225 and 226:
5.4 • Algae 211 and other photosy
- Page 227 and 228:
5.5 • Lichens 213 Figure 5.37 Chl
- Page 229 and 230:
5.5 • Lichens 215 marina. (b) Thi
- Page 231 and 232:
5 • Review Questions 217 REVIEW Q
- Page 233 and 234:
CHAPTER 6 Acellular Pathogens Figur
- Page 235 and 236:
6.1 • Viruses 221 assembly of vir
- Page 237 and 238:
6.1 • Viruses 223 Viral Structure
- Page 239 and 240:
6.1 • Viruses 225 Figure 6.5 (a)
- Page 241 and 242:
6.1 • Viruses 227 LINK TO LEARNIN
- Page 243 and 244:
6.2 • The Viral Life Cycle 229 on
- Page 245 and 246:
6.2 • The Viral Life Cycle 231 Fi
- Page 247 and 248:
6.2 • The Viral Life Cycle 233 Fi
- Page 249 and 250:
6.2 • The Viral Life Cycle 235 Fi
- Page 251 and 252:
6.2 • The Viral Life Cycle 237 by
- Page 253 and 254:
6.2 • The Viral Life Cycle 239 Ca
- Page 255 and 256:
6.3 • Isolation, Culture, and Ide
- Page 257 and 258:
6.3 • Isolation, Culture, and Ide
- Page 259 and 260:
6.3 • Isolation, Culture, and Ide
- Page 261 and 262:
6.3 • Isolation, Culture, and Ide
- Page 263 and 264:
6.4 • Viroids, Virusoids, and Pri
- Page 265 and 266:
6.4 • Viroids, Virusoids, and Pri
- Page 267 and 268:
6 • Summary 253 SUMMARY 6.1 Virus
- Page 269 and 270:
6 • Review Questions 255 18. A/an
- Page 271 and 272:
CHAPTER 7 Microbial Biochemistry Fi
- Page 273 and 274:
7.1 • Organic Molecules 259 Figur
- Page 275 and 276:
7.1 • Organic Molecules 261 Figur
- Page 277 and 278:
7.2 • Carbohydrates 263 and the m
- Page 279 and 280:
7.2 • Carbohydrates 265 Figure 7.
- Page 281 and 282:
7.3 • Lipids 267 Figure 7.11 Star
- Page 283 and 284:
7.3 • Lipids 269 Figure 7.13 This
- Page 285 and 286:
7.3 • Lipids 271 Figure 7.15 Five
- Page 287 and 288:
7.4 • Proteins 273 Figure 7.17 Am
- Page 289 and 290:
7.4 • Proteins 275 Figure 7.19 Re
- Page 291 and 292:
7.4 • Proteins 277 Figure 7.23 Pr
- Page 293 and 294:
7.5 • Using Biochemistry to Ident
- Page 295 and 296:
7.5 • Using Biochemistry to Ident
- Page 297 and 298:
7 • Review Questions 283 as hormo
- Page 299 and 300:
7 • Review Questions 285 19. A tr
- Page 301 and 302:
CHAPTER 8 Microbial Metabolism Figu
- Page 303 and 304:
8.1 • Energy, Matter, and Enzymes
- Page 305 and 306:
8.1 • Energy, Matter, and Enzymes
- Page 307 and 308:
8.1 • Energy, Matter, and Enzymes
- Page 309 and 310:
8.2 • Catabolism of Carbohydrates
- Page 311 and 312:
8.2 • Catabolism of Carbohydrates
- Page 313 and 314:
8.2 • Catabolism of Carbohydrates
- Page 315 and 316:
8.3 • Cellular Respiration 301 8.
- Page 317 and 318: 8.3 • Cellular Respiration 303 Fi
- Page 319 and 320: 8.4 • Fermentation 305 If respira
- Page 321 and 322: 8.4 • Fermentation 307 Common Fer
- Page 323 and 324: 8.5 • Catabolism of Lipids and Pr
- Page 325 and 326: 8.6 • Photosynthesis 311 independ
- Page 327 and 328: 8.6 • Photosynthesis 313 Oxygenic
- Page 329 and 330: 8.7 • Biogeochemical Cycles 315 L
- Page 331 and 332: 8.7 • Biogeochemical Cycles 317 N
- Page 333 and 334: 8.7 • Biogeochemical Cycles 319 F
- Page 335 and 336: 8.7 • Biogeochemical Cycles 321 F
- Page 337 and 338: 8 • Summary 323 oxygen as the fin
- Page 339 and 340: 8 • Review Questions 325 4. To wh
- Page 341 and 342: 8 • Review Questions 327 Matching
- Page 343 and 344: CHAPTER 9 Microbial Growth Figure 9
- Page 345 and 346: 9.1 • How Microbes Grow 331 and a
- Page 347 and 348: 9.1 • How Microbes Grow 333 The G
- Page 349 and 350: 9.1 • How Microbes Grow 335 Susta
- Page 351 and 352: 9.1 • How Microbes Grow 337 chang
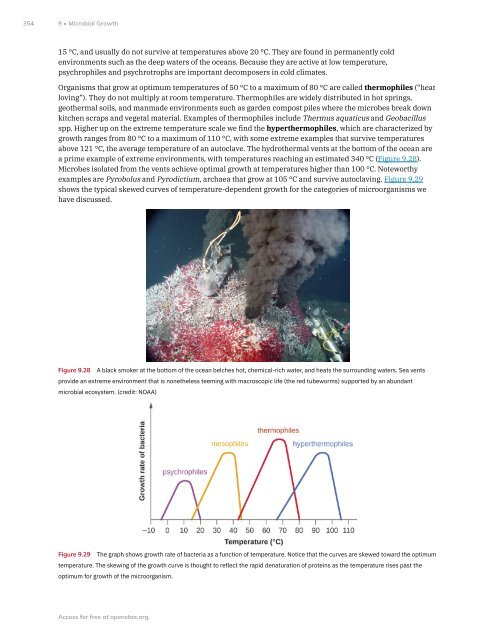
- Page 353 and 354: 9.1 • How Microbes Grow 339 Figur
- Page 355 and 356: 9.1 • How Microbes Grow 341 trans
- Page 357 and 358: 9.1 • How Microbes Grow 343 micro
- Page 359 and 360: 9.2 • Oxygen Requirements for Mic
- Page 361 and 362: 9.2 • Oxygen Requirements for Mic
- Page 363 and 364: 9.2 • Oxygen Requirements for Mic
- Page 365 and 366: 9.3 • The Effects of pH on Microb
- Page 367: 9.4 • Temperature and Microbial G
- Page 371 and 372: 9.5 • Other Environmental Conditi
- Page 373 and 374: 9.6 • Media Used for Bacterial Gr
- Page 375 and 376: 9 • Summary 361 SUMMARY 9.1 How M
- Page 377 and 378: 9 • Review Questions 363 7. Filam
- Page 379 and 380: 9 • Review Questions 365 Matching
- Page 381 and 382: 9 • Review Questions 367 Critical
- Page 383 and 384: CHAPTER 10 Biochemistry of the Geno
- Page 385 and 386: 10.1 • Using Microbiology to Disc
- Page 387 and 388: 10.1 • Using Microbiology to Disc
- Page 389 and 390: 10.1 • Using Microbiology to Disc
- Page 391 and 392: 10.1 • Using Microbiology to Disc
- Page 393 and 394: 10.1 • Using Microbiology to Disc
- Page 395 and 396: 10.2 • Structure and Function of
- Page 397 and 398: 10.2 • Structure and Function of
- Page 399 and 400: 10.2 • Structure and Function of
- Page 401 and 402: 10.2 • Structure and Function of
- Page 403 and 404: 10.3 • Structure and Function of
- Page 405 and 406: 10.3 • Structure and Function of
- Page 407 and 408: 10.4 • Structure and Function of
- Page 409 and 410: 10.4 • Structure and Function of
- Page 411 and 412: 10.4 • Structure and Function of
- Page 413 and 414: 10.4 • Structure and Function of
- Page 415 and 416: 10 • Summary 401 SUMMARY 10.1 Usi
- Page 417 and 418: 10 • Review Questions 403 3. Whic
- Page 419 and 420:
10 • Review Questions 405 Short A
- Page 421 and 422:
CHAPTER 11 Mechanisms of Microbial
- Page 423 and 424:
11.1 • The Functions of Genetic M
- Page 425 and 426:
11.2 • DNA Replication 411 Figure
- Page 427 and 428:
11.2 • DNA Replication 413 Figure
- Page 429 and 430:
11.2 • DNA Replication 415 strand
- Page 431 and 432:
11.2 • DNA Replication 417 telome
- Page 433 and 434:
11.3 • RNA Transcription 419 Figu
- Page 435 and 436:
11.3 • RNA Transcription 421 the
- Page 437 and 438:
11.4 • Protein Synthesis (Transla
- Page 439 and 440:
11.4 • Protein Synthesis (Transla
- Page 441 and 442:
11.4 • Protein Synthesis (Transla
- Page 443 and 444:
11.5 • Mutations 429 Effects of M
- Page 445 and 446:
11.5 • Mutations 431 In recent ye
- Page 447 and 448:
11.5 • Mutations 433 Figure 11.20
- Page 449 and 450:
11.5 • Mutations 435 formation of
- Page 451 and 452:
11.5 • Mutations 437 Figure 11.23
- Page 453 and 454:
11.5 • Mutations 439 Figure 11.24
- Page 455 and 456:
11.6 • How Asexual Prokaryotes Ac
- Page 457 and 458:
11.6 • How Asexual Prokaryotes Ac
- Page 459 and 460:
11.6 • How Asexual Prokaryotes Ac
- Page 461 and 462:
11.7 • Gene Regulation: Operon Th
- Page 463 and 464:
11.7 • Gene Regulation: Operon Th
- Page 465 and 466:
11.7 • Gene Regulation: Operon Th
- Page 467 and 468:
11.7 • Gene Regulation: Operon Th
- Page 469 and 470:
11.7 • Gene Regulation: Operon Th
- Page 471 and 472:
11 • Summary 457 SUMMARY 11.1 The
- Page 473 and 474:
11 • Summary 459 undamaged DNA st
- Page 475 and 476:
11 • Review Questions 461 11. Whi
- Page 477 and 478:
11 • Review Questions 463 46. ___
- Page 479 and 480:
71. The following figure is from Mo
- Page 481 and 482:
CHAPTER 12 Modern Applications of M
- Page 483 and 484:
12.1 • Microbes and the Tools of
- Page 485 and 486:
12.1 • Microbes and the Tools of
- Page 487 and 488:
12.1 • Microbes and the Tools of
- Page 489 and 490:
12.1 • Microbes and the Tools of
- Page 491 and 492:
12.1 • Microbes and the Tools of
- Page 493 and 494:
12.2 • Visualizing and Characteri
- Page 495 and 496:
12.2 • Visualizing and Characteri
- Page 497 and 498:
12.2 • Visualizing and Characteri
- Page 499 and 500:
12.2 • Visualizing and Characteri
- Page 501 and 502:
12.2 • Visualizing and Characteri
- Page 503 and 504:
12.2 • Visualizing and Characteri
- Page 505 and 506:
12.2 • Visualizing and Characteri
- Page 507 and 508:
12.2 • Visualizing and Characteri
- Page 509 and 510:
12.3 • Whole Genome Methods and P
- Page 511 and 512:
12.3 • Whole Genome Methods and P
- Page 513 and 514:
12.4 • Gene Therapy 499 Figure 12
- Page 515 and 516:
12.4 • Gene Therapy 501 overall w
- Page 517 and 518:
12 • Summary 503 SUMMARY 12.1 Mic
- Page 519 and 520:
12 • Review Questions 505 11. The
- Page 521 and 522:
CHAPTER 13 Control of Microbial Gro
- Page 523 and 524:
13.1 • Controlling Microbial Grow
- Page 525 and 526:
13.1 • Controlling Microbial Grow
- Page 527 and 528:
13.1 • Controlling Microbial Grow
- Page 529 and 530:
13.2 • Using Physical Methods to
- Page 531 and 532:
13.2 • Using Physical Methods to
- Page 533 and 534:
13.2 • Using Physical Methods to
- Page 535 and 536:
13.2 • Using Physical Methods to
- Page 537 and 538:
13.2 • Using Physical Methods to
- Page 539 and 540:
13.2 • Using Physical Methods to
- Page 541 and 542:
13.2 • Using Physical Methods to
- Page 543 and 544:
13.3 • Using Chemicals to Control
- Page 545 and 546:
13.3 • Using Chemicals to Control
- Page 547 and 548:
13.3 • Using Chemicals to Control
- Page 549 and 550:
13.3 • Using Chemicals to Control
- Page 551 and 552:
13.3 • Using Chemicals to Control
- Page 553 and 554:
13.3 • Using Chemicals to Control
- Page 555 and 556:
13.3 • Using Chemicals to Control
- Page 557 and 558:
13.3 • Using Chemicals to Control
- Page 559 and 560:
13.3 • Using Chemicals to Control
- Page 561 and 562:
13.4 • Testing the Effectiveness
- Page 563 and 564:
13.4 • Testing the Effectiveness
- Page 565 and 566:
13.4 • Testing the Effectiveness
- Page 567 and 568:
13 • Summary 553 commonly used to
- Page 569 and 570:
13 • Review Questions 555 12. Ble
- Page 571 and 572:
CHAPTER 14 Antimicrobial Drugs Figu
- Page 573 and 574:
14.1 • History of Chemotherapy an
- Page 575 and 576:
14.1 • History of Chemotherapy an
- Page 577 and 578:
14.2 • Fundamentals of Antimicrob
- Page 579 and 580:
14.2 • Fundamentals of Antimicrob
- Page 581 and 582:
14.3 • Mechanisms of Antibacteria
- Page 583 and 584:
14.3 • Mechanisms of Antibacteria
- Page 585 and 586:
14.3 • Mechanisms of Antibacteria
- Page 587 and 588:
14.3 • Mechanisms of Antibacteria
- Page 589 and 590:
14.3 • Mechanisms of Antibacteria
- Page 591 and 592:
14.3 • Mechanisms of Antibacteria
- Page 593 and 594:
14.3 • Mechanisms of Antibacteria
- Page 595 and 596:
14.4 • Mechanisms of Other Antimi
- Page 597 and 598:
14.4 • Mechanisms of Other Antimi
- Page 599 and 600:
14.4 • Mechanisms of Other Antimi
- Page 601 and 602:
14.4 • Mechanisms of Other Antimi
- Page 603 and 604:
14.4 • Mechanisms of Other Antimi
- Page 605 and 606:
14.5 • Drug Resistance 591 Common
- Page 607 and 608:
14.5 • Drug Resistance 593 negati
- Page 609 and 610:
14.5 • Drug Resistance 595 Clavul
- Page 611 and 612:
14.6 • Testing the Effectiveness
- Page 613 and 614:
14.6 • Testing the Effectiveness
- Page 615 and 616:
14.7 • Current Strategies for Ant
- Page 617 and 618:
14.7 • Current Strategies for Ant
- Page 619 and 620:
14 • Summary 605 cells. • Becau
- Page 621 and 622:
14 • Review Questions 607 11. Whi
- Page 623 and 624:
14 • Review Questions 609 50. Why
- Page 625 and 626:
CHAPTER 15 Microbial Mechanisms of
- Page 627 and 628:
15.1 • Characteristics of Infecti
- Page 629 and 630:
15.1 • Characteristics of Infecti
- Page 631 and 632:
15.1 • Characteristics of Infecti
- Page 633 and 634:
15.2 • How Pathogens Cause Diseas
- Page 635 and 636:
15.2 • How Pathogens Cause Diseas
- Page 637 and 638:
15.2 • How Pathogens Cause Diseas
- Page 639 and 640:
15.2 • How Pathogens Cause Diseas
- Page 641 and 642:
15.2 • How Pathogens Cause Diseas
- Page 643 and 644:
15.3 • Virulence Factors of Bacte
- Page 645 and 646:
15.3 • Virulence Factors of Bacte
- Page 647 and 648:
15.3 • Virulence Factors of Bacte
- Page 649 and 650:
15.3 • Virulence Factors of Bacte
- Page 651 and 652:
15.3 • Virulence Factors of Bacte
- Page 653 and 654:
15.3 • Virulence Factors of Bacte
- Page 655 and 656:
15.3 • Virulence Factors of Bacte
- Page 657 and 658:
15.4 • Virulence Factors of Eukar
- Page 659 and 660:
15.4 • Virulence Factors of Eukar
- Page 661 and 662:
15 • Review Questions 647 protect
- Page 663 and 664:
15 • Review Questions 649 Critica
- Page 665 and 666:
CHAPTER 16 Disease and Epidemiology
- Page 667 and 668:
16.1 • The Language of Epidemiolo
- Page 669 and 670:
16.1 • The Language of Epidemiolo
- Page 671 and 672:
16.2 • Tracking Infectious Diseas
- Page 673 and 674:
16.2 • Tracking Infectious Diseas
- Page 675 and 676:
16.2 • Tracking Infectious Diseas
- Page 677 and 678:
16.3 • Modes of Disease Transmiss
- Page 679 and 680:
16.3 • Modes of Disease Transmiss
- Page 681 and 682:
16.3 • Modes of Disease Transmiss
- Page 683 and 684:
16.3 • Modes of Disease Transmiss
- Page 685 and 686:
16.3 • Modes of Disease Transmiss
- Page 687 and 688:
16.4 • Global Public Health 673 C
- Page 689 and 690:
16.4 • Global Public Health 675 S
- Page 691 and 692:
16 • Summary 677 SUMMARY 16.1 The
- Page 693 and 694:
16 • Review Questions 679 Matchin
- Page 695 and 696:
16 • Review Questions 681 20. Wha
- Page 697 and 698:
CHAPTER 17 Innate Nonspecific Host
- Page 699 and 700:
17.1 • Physical Defenses 685 Over
- Page 701 and 702:
17.1 • Physical Defenses 687 know
- Page 703 and 704:
17.1 • Physical Defenses 689 Figu
- Page 705 and 706:
17.2 • Chemical Defenses 691 Phys
- Page 707 and 708:
17.2 • Chemical Defenses 693 sali
- Page 709 and 710:
17.2 • Chemical Defenses 695 prod
- Page 711 and 712:
17.2 • Chemical Defenses 697 Figu
- Page 713 and 714:
17.2 • Chemical Defenses 699 Clin
- Page 715 and 716:
17.3 • Cellular Defenses 701 Hema
- Page 717 and 718:
17.3 • Cellular Defenses 703 stra
- Page 719 and 720:
17.3 • Cellular Defenses 705 Clin
- Page 721 and 722:
17.3 • Cellular Defenses 707 Figu
- Page 723 and 724:
17.4 • Pathogen Recognition and P
- Page 725 and 726:
17.4 • Pathogen Recognition and P
- Page 727 and 728:
17.5 • Inflammation and Fever 713
- Page 729 and 730:
17.5 • Inflammation and Fever 715
- Page 731 and 732:
17.5 • Inflammation and Fever 717
- Page 733 and 734:
17 • Summary 719 SUMMARY 17.1 Phy
- Page 735 and 736:
17 • Review Questions 721 8. Hist
- Page 737 and 738:
17 • Review Questions 723 Short A
- Page 739 and 740:
CHAPTER 18 Adaptive Specific Host D
- Page 741 and 742:
18.1 • Overview of Specific Adapt
- Page 743 and 744:
18.1 • Overview of Specific Adapt
- Page 745 and 746:
18.1 • Overview of Specific Adapt
- Page 747 and 748:
18.1 • Overview of Specific Adapt
- Page 749 and 750:
18.2 • Major Histocompatibility C
- Page 751 and 752:
18.3 • T Lymphocytes and Cellular
- Page 753 and 754:
18.3 • T Lymphocytes and Cellular
- Page 755 and 756:
18.3 • T Lymphocytes and Cellular
- Page 757 and 758:
18.3 • T Lymphocytes and Cellular
- Page 759 and 760:
18.3 • T Lymphocytes and Cellular
- Page 761 and 762:
18.4 • B Lymphocytes and Humoral
- Page 763 and 764:
18.4 • B Lymphocytes and Humoral
- Page 765 and 766:
18.5 • Vaccines 751 pathogen—bu
- Page 767 and 768:
18.5 • Vaccines 753 Eye on Ethics
- Page 769 and 770:
18.5 • Vaccines 755 for Disease C
- Page 771 and 772:
18.5 • Vaccines 757 Classes of Va
- Page 773 and 774:
18 • Summary 759 SUMMARY 18.1 Ove
- Page 775 and 776:
18 • Review Questions 761 5. MHC
- Page 777 and 778:
18 • Review Questions 763 20. Mat
- Page 779 and 780:
CHAPTER 19 Diseases of the Immune S
- Page 781 and 782:
19.1 • Hypersensitivities 767 Fig
- Page 783 and 784:
19.1 • Hypersensitivities 769 bin
- Page 785 and 786:
19.1 • Hypersensitivities 771 mec
- Page 787 and 788:
19.1 • Hypersensitivities 773 Fig
- Page 789 and 790:
19.1 • Hypersensitivities 775 CHE
- Page 791 and 792:
19.1 • Hypersensitivities 777 Cli
- Page 793 and 794:
19.1 • Hypersensitivities 779 MIC
- Page 795 and 796:
19.1 • Hypersensitivities 781 Fig
- Page 797 and 798:
19.2 • Autoimmune Disorders 783 t
- Page 799 and 800:
19.2 • Autoimmune Disorders 785 F
- Page 801 and 802:
19.2 • Autoimmune Disorders 787 M
- Page 803 and 804:
19.2 • Autoimmune Disorders 789 F
- Page 805 and 806:
19.3 • Organ Transplantation and
- Page 807 and 808:
19.4 • Immunodeficiency 793 and m
- Page 809 and 810:
19.4 • Immunodeficiency 795 CHECK
- Page 811 and 812:
19.5 • Cancer Immunobiology and I
- Page 813 and 814:
19 • Summary 799 SUMMARY 19.1 Hyp
- Page 815 and 816:
19 • Review Questions 801 13. All
- Page 817 and 818:
CHAPTER 20 Laboratory Analysis of t
- Page 819 and 820:
20.1 • Polyclonal and Monoclonal
- Page 821 and 822:
20.1 • Polyclonal and Monoclonal
- Page 823 and 824:
20.1 • Polyclonal and Monoclonal
- Page 825 and 826:
20.2 • Detecting Antigen-Antibody
- Page 827 and 828:
20.2 • Detecting Antigen-Antibody
- Page 829 and 830:
20.2 • Detecting Antigen-Antibody
- Page 831 and 832:
20.2 • Detecting Antigen-Antibody
- Page 833 and 834:
20.2 • Detecting Antigen-Antibody
- Page 835 and 836:
20.2 • Detecting Antigen-Antibody
- Page 837 and 838:
20.3 • Agglutination Assays 823 a
- Page 839 and 840:
20.3 • Agglutination Assays 825 F
- Page 841 and 842:
20.3 • Agglutination Assays 827 e
- Page 843 and 844:
20.3 • Agglutination Assays 829 s
- Page 845 and 846:
20.4 • EIAs and ELISAs 831 Mechan
- Page 847 and 848:
20.4 • EIAs and ELISAs 833 Figure
- Page 849 and 850:
20.4 • EIAs and ELISAs 835 Figure
- Page 851 and 852:
20.4 • EIAs and ELISAs 837 • Wh
- Page 853 and 854:
20.4 • EIAs and ELISAs 839 Figure
- Page 855 and 856:
20.5 • Fluorescent Antibody Techn
- Page 857 and 858:
20.5 • Fluorescent Antibody Techn
- Page 859 and 860:
20.5 • Fluorescent Antibody Techn
- Page 861 and 862:
20.5 • Fluorescent Antibody Techn
- Page 863 and 864:
20 • Review Questions 849 20.4 EI
- Page 865 and 866:
20 • Review Questions 851 15. Sup
- Page 867 and 868:
CHAPTER 21 Skin and Eye Infections
- Page 869 and 870:
21.1 • Anatomy and Normal Microbi
- Page 871 and 872:
21.1 • Anatomy and Normal Microbi
- Page 873 and 874:
21.1 • Anatomy and Normal Microbi
- Page 875 and 876:
21.2 • Bacterial Infections of th
- Page 877 and 878:
21.2 • Bacterial Infections of th
- Page 879 and 880:
21.2 • Bacterial Infections of th
- Page 881 and 882:
21.2 • Bacterial Infections of th
- Page 883 and 884:
21.2 • Bacterial Infections of th
- Page 885 and 886:
21.2 • Bacterial Infections of th
- Page 887 and 888:
21.2 • Bacterial Infections of th
- Page 889 and 890:
21.2 • Bacterial Infections of th
- Page 891 and 892:
21.3 • Viral Infections of the Sk
- Page 893 and 894:
21.3 • Viral Infections of the Sk
- Page 895 and 896:
21.4 • Mycoses of the Skin 881 se
- Page 897 and 898:
21.4 • Mycoses of the Skin 883 fr
- Page 899 and 900:
21.4 • Mycoses of the Skin 885 Fi
- Page 901 and 902:
21.5 • Protozoan and Helminthic I
- Page 903 and 904:
21.5 • Protozoan and Helminthic I
- Page 905 and 906:
21 • Summary 891 SUMMARY 21.1 Ana
- Page 907 and 908:
21 • Review Questions 893 10. Whi
- Page 909 and 910:
CHAPTER 22 Respiratory System Infec
- Page 911 and 912:
22.1 • Anatomy and Normal Microbi
- Page 913 and 914:
22.1 • Anatomy and Normal Microbi
- Page 915 and 916:
22.2 • Bacterial Infections of th
- Page 917 and 918:
22.2 • Bacterial Infections of th
- Page 919 and 920:
22.2 • Bacterial Infections of th
- Page 921 and 922:
22.2 • Bacterial Infections of th
- Page 923 and 924:
22.2 • Bacterial Infections of th
- Page 925 and 926:
22.2 • Bacterial Infections of th
- Page 927 and 928:
22.2 • Bacterial Infections of th
- Page 929 and 930:
22.2 • Bacterial Infections of th
- Page 931 and 932:
22.2 • Bacterial Infections of th
- Page 933 and 934:
22.3 • Viral Infections of the Re
- Page 935 and 936:
22.3 • Viral Infections of the Re
- Page 937 and 938:
22.3 • Viral Infections of the Re
- Page 939 and 940:
22.3 • Viral Infections of the Re
- Page 941 and 942:
22.3 • Viral Infections of the Re
- Page 943 and 944:
22.3 • Viral Infections of the Re
- Page 945 and 946:
22.4 • Respiratory Mycoses 931 ha
- Page 947 and 948:
22.4 • Respiratory Mycoses 933 Fi
- Page 949 and 950:
22.4 • Respiratory Mycoses 935 re
- Page 951 and 952:
Figure 22.29 22.4 • Respiratory M
- Page 953 and 954:
22 • Review Questions 939 200 vir
- Page 955 and 956:
22 • Review Questions 941 18. Whi
- Page 957 and 958:
CHAPTER 23 Urogenital System Infect
- Page 959 and 960:
23.1 • Anatomy and Normal Microbi
- Page 961 and 962:
23.1 • Anatomy and Normal Microbi
- Page 963 and 964:
23.2 • Bacterial Infections of th
- Page 965 and 966:
23.2 • Bacterial Infections of th
- Page 967 and 968:
23.2 • Bacterial Infections of th
- Page 969 and 970:
23.3 • Bacterial Infections of th
- Page 971 and 972:
23.3 • Bacterial Infections of th
- Page 973 and 974:
23.3 • Bacterial Infections of th
- Page 975 and 976:
23.3 • Bacterial Infections of th
- Page 977 and 978:
23.4 • Viral Infections of the Re
- Page 979 and 980:
23.4 • Viral Infections of the Re
- Page 981 and 982:
23.4 • Viral Infections of the Re
- Page 983 and 984:
23.5 • Fungal Infections of the R
- Page 985 and 986:
23.6 • Protozoan Infections of th
- Page 987 and 988:
23.6 • Protozoan Infections of th
- Page 989 and 990:
23 • Summary 975 SUMMARY 23.1 Ana
- Page 991 and 992:
23 • Review Questions 977 11. Whi
- Page 993 and 994:
CHAPTER 24 Digestive System Infecti
- Page 995 and 996:
24.1 • Anatomy and Normal Microbi
- Page 997 and 998:
24.1 • Anatomy and Normal Microbi
- Page 999 and 1000:
24.1 • Anatomy and Normal Microbi
- Page 1001 and 1002:
24.2 • Microbial Diseases of the
- Page 1003 and 1004:
24.2 • Microbial Diseases of the
- Page 1005 and 1006:
24.2 • Microbial Diseases of the
- Page 1007 and 1008:
24.3 • Bacterial Infections of th
- Page 1009 and 1010:
24.3 • Bacterial Infections of th
- Page 1011 and 1012:
24.3 • Bacterial Infections of th
- Page 1013 and 1014:
24.3 • Bacterial Infections of th
- Page 1015 and 1016:
24.3 • Bacterial Infections of th
- Page 1017 and 1018:
24.3 • Bacterial Infections of th
- Page 1019 and 1020:
24.3 • Bacterial Infections of th
- Page 1021 and 1022:
24.3 • Bacterial Infections of th
- Page 1023 and 1024:
24.3 • Bacterial Infections of th
- Page 1025 and 1026:
24.4 • Viral Infections of the Ga
- Page 1027 and 1028:
24.4 • Viral Infections of the Ga
- Page 1029 and 1030:
24.4 • Viral Infections of the Ga
- Page 1031 and 1032:
24.5 • Protozoan Infections of th
- Page 1033 and 1034:
24.5 • Protozoan Infections of th
- Page 1035 and 1036:
24.6 • Helminthic Infections of t
- Page 1037 and 1038:
24.6 • Helminthic Infections of t
- Page 1039 and 1040:
24.6 • Helminthic Infections of t
- Page 1041 and 1042:
24.6 • Helminthic Infections of t
- Page 1043 and 1044:
24.6 • Helminthic Infections of t
- Page 1045 and 1046:
24.6 • Helminthic Infections of t
- Page 1047 and 1048:
24 • Summary 1033 SUMMARY 24.1 An
- Page 1049 and 1050:
24 • Review Questions 1035 6. Whi
- Page 1051 and 1052:
CHAPTER 25 Circulatory and Lymphati
- Page 1053 and 1054:
25.1 • Anatomy of the Circulatory
- Page 1055 and 1056:
25.1 • Anatomy of the Circulatory
- Page 1057 and 1058:
25.2 • Bacterial Infections of th
- Page 1059 and 1060:
25.2 • Bacterial Infections of th
- Page 1061 and 1062:
25.2 • Bacterial Infections of th
- Page 1063 and 1064:
25.2 • Bacterial Infections of th
- Page 1065 and 1066:
25.2 • Bacterial Infections of th
- Page 1067 and 1068:
25.2 • Bacterial Infections of th
- Page 1069 and 1070:
25.2 • Bacterial Infections of th
- Page 1071 and 1072:
25.2 • Bacterial Infections of th
- Page 1073 and 1074:
25.2 • Bacterial Infections of th
- Page 1075 and 1076:
25.2 • Bacterial Infections of th
- Page 1077 and 1078:
25.2 • Bacterial Infections of th
- Page 1079 and 1080:
25.3 • Viral Infections of the Ci
- Page 1081 and 1082:
25.3 • Viral Infections of the Ci
- Page 1083 and 1084:
25.3 • Viral Infections of the Ci
- Page 1085 and 1086:
25.3 • Viral Infections of the Ci
- Page 1087 and 1088:
25.3 • Viral Infections of the Ci
- Page 1089 and 1090:
Figure 25.26 25.3 • Viral Infecti
- Page 1091 and 1092:
25.4 • Parasitic Infections of th
- Page 1093 and 1094:
25.4 • Parasitic Infections of th
- Page 1095 and 1096:
25.4 • Parasitic Infections of th
- Page 1097 and 1098:
25.4 • Parasitic Infections of th
- Page 1099 and 1100:
25.4 • Parasitic Infections of th
- Page 1101 and 1102:
25.4 • Parasitic Infections of th
- Page 1103 and 1104:
25 • Review Questions 1089 • To
- Page 1105 and 1106:
25 • Review Questions 1091 Critic
- Page 1107 and 1108:
CHAPTER 26 Nervous System Infection
- Page 1109 and 1110:
26.1 • Anatomy of the Nervous Sys
- Page 1111 and 1112:
26.1 • Anatomy of the Nervous Sys
- Page 1113 and 1114:
26.2 • Bacterial Diseases of the
- Page 1115 and 1116:
26.2 • Bacterial Diseases of the
- Page 1117 and 1118:
26.2 • Bacterial Diseases of the
- Page 1119 and 1120:
26.2 • Bacterial Diseases of the
- Page 1121 and 1122:
26.2 • Bacterial Diseases of the
- Page 1123 and 1124:
26.2 • Bacterial Diseases of the
- Page 1125 and 1126:
26.2 • Bacterial Diseases of the
- Page 1127 and 1128:
26.3 • Acellular Diseases of the
- Page 1129 and 1130:
26.3 • Acellular Diseases of the
- Page 1131 and 1132:
26.3 • Acellular Diseases of the
- Page 1133 and 1134:
26.3 • Acellular Diseases of the
- Page 1135 and 1136:
26.3 • Acellular Diseases of the
- Page 1137 and 1138:
Figure 26.19 26.3 • Acellular Dis
- Page 1139 and 1140:
26.4 • Fungal and Parasitic Disea
- Page 1141 and 1142:
26.4 • Fungal and Parasitic Disea
- Page 1143 and 1144:
26.4 • Fungal and Parasitic Disea
- Page 1145 and 1146:
26.4 • Fungal and Parasitic Disea
- Page 1147 and 1148:
26 • Review Questions 1133 are fa
- Page 1149 and 1150:
26 • Review Questions 1135 Matchi
- Page 1151 and 1152:
26 • Review Questions 1137 59. Th
- Page 1153 and 1154:
A • Fundamentals of Physics and C
- Page 1155 and 1156:
A • Fundamentals of Physics and C
- Page 1157 and 1158:
A • Fundamentals of Physics and C
- Page 1159 and 1160:
A • Fundamentals of Physics and C
- Page 1161 and 1162:
A • Fundamentals of Physics and C
- Page 1163 and 1164:
B • Mathematical Basics 1149 APPE
- Page 1165 and 1166:
B • Mathematical Basics 1151 Mult
- Page 1167 and 1168:
B • Mathematical Basics 1153 The
- Page 1169 and 1170:
C • Metabolic Pathways 1155 APPEN
- Page 1171 and 1172:
C • Metabolic Pathways 1157 Entne
- Page 1173 and 1174:
C • Metabolic Pathways 1159 Figur
- Page 1175 and 1176:
C • Metabolic Pathways 1161 Elect
- Page 1177 and 1178:
APPENDIX D Taxonomy of Clinically R
- Page 1179 and 1180:
D • Taxonomy of Clinically Releva
- Page 1181 and 1182:
D • Taxonomy of Clinically Releva
- Page 1183 and 1184:
D • Taxonomy of Clinically Releva
- Page 1185 and 1186:
D • Taxonomy of Clinically Releva
- Page 1187 and 1188:
D • Taxonomy of Clinically Releva
- Page 1189 and 1190:
D • Taxonomy of Clinically Releva
- Page 1191 and 1192:
E • Glossary 1177 APPENDIX E Glos
- Page 1193 and 1194:
E • Glossary 1179 destruction by
- Page 1195 and 1196:
E • Glossary 1181 pollutants from
- Page 1197 and 1198:
E • Glossary 1183 chromosome disc
- Page 1199 and 1200:
E • Glossary 1185 cysts are forme
- Page 1201 and 1202:
E • Glossary 1187 occurring ectop
- Page 1203 and 1204:
E • Glossary 1189 molecules of DN
- Page 1205 and 1206:
E • Glossary 1191 glycoprotein co
- Page 1207 and 1208:
E • Glossary 1193 image point is
- Page 1209 and 1210:
E • Glossary 1195 discontinuously
- Page 1211 and 1212:
E • Glossary 1197 infection cause
- Page 1213 and 1214:
E • Glossary 1199 target cells by
- Page 1215 and 1216:
E • Glossary 1201 intact ribosome
- Page 1217 and 1218:
E • Glossary 1203 point source sp
- Page 1219 and 1220:
E • Glossary 1205 complexes forme
- Page 1221 and 1222:
E • Glossary 1207 antibody is fir
- Page 1223 and 1224:
E • Glossary 1209 the number of c
- Page 1225 and 1226:
E • Glossary 1211 the reciprocal
- Page 1227 and 1228:
E • Glossary 1213 vector animal (
- Page 1229 and 1230:
1215 ANSWER KEY Chapter 1 1. D 2. D
- Page 1231 and 1232:
1217 B 18. A, C, B 19. peristalsis
- Page 1233 and 1234:
Index 1219 INDEX Symbols +ssRNA 237
- Page 1235 and 1236:
Index 1221 antigen-presenting cells
- Page 1237 and 1238:
Index 1223 Bordetella 142 Bordetell
- Page 1239 and 1240:
Index 1225 chromosomes 372, 394 chr
- Page 1241 and 1242:
Index 1227 de Duve 113 dead zone 35
- Page 1243 and 1244:
Index 1229 Enteroinvasive E. coli (
- Page 1245 and 1246:
Index 1231 Gardnerella vaginalis 47
- Page 1247 and 1248:
Index 1233 shunt 298 Hfr cell 443 H
- Page 1249 and 1250:
Index 1235 iron lungs 1118 iron-sul
- Page 1251 and 1252:
Index 1237 maturation 230 mature na
- Page 1253 and 1254:
Index 1239 Health 501 National Noti
- Page 1255 and 1256:
Index 1241 patterns (PAMPs) 710 pat
- Page 1257 and 1258:
Index 1243 primary lymphoid tissue
- Page 1259 and 1260:
Index 1245 596, 1048, 1051, 1051 ri
- Page 1261 and 1262:
Index 1247 sterilant 511, 541 steri
- Page 1263 and 1264:
Index 1249 toxigenicity 633 toxin 6
- Page 1265:
Index 1251 water activity 522 water