Annual Report 2010 - Enel.com
Annual Report 2010 - Enel.com
Annual Report 2010 - Enel.com

You also want an ePaper? Increase the reach of your titles
YUMPU automatically turns print PDFs into web optimized ePapers that Google loves.
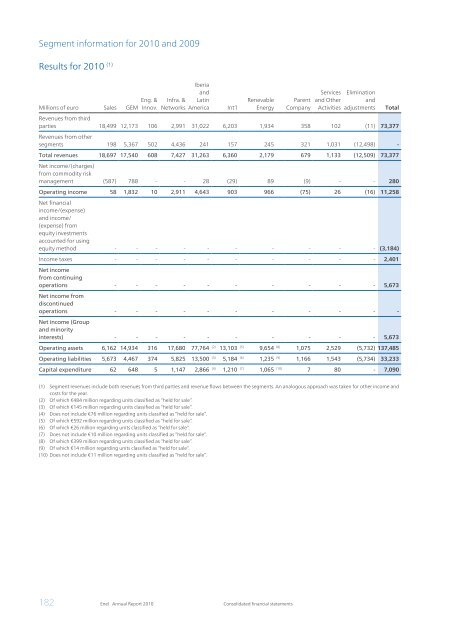
Segment information for <strong>2010</strong> and 2009<br />
Results for <strong>2010</strong> (1)<br />
Millions of euro Sales GEM<br />
Eng. &<br />
Innov.<br />
Infra. &<br />
Networks<br />
Iberia<br />
and<br />
Latin<br />
America Int’l<br />
Renevable<br />
Energy<br />
182 <strong>Enel</strong> <strong>Annual</strong> <strong>Report</strong> <strong>2010</strong> Consolidated financial statements<br />
Parent<br />
Company<br />
Services<br />
and Other<br />
Activities<br />
Elimination<br />
and<br />
adjustments Total<br />
Revenues from third<br />
parties 18,499 12,173 106 2,991 31,022 6,203 1,934 358 102 (11) 73,377<br />
Revenues from other<br />
segments 198 5,367 502 4,436 241 157 245 321 1,031 (12,498) -<br />
Total revenues 18,697 17,540 608 7,427 31,263 6,360 2,179 679 1,133 (12,509) 73,377<br />
Net in<strong>com</strong>e/(charges)<br />
from <strong>com</strong>modity risk<br />
management (587) 788 - - 28 (29) 89 (9) - - 280<br />
Operating in<strong>com</strong>e 58 1,832 10 2,911 4,643 903 966 (75) 26 (16) 11,258<br />
Net financial<br />
in<strong>com</strong>e/(expense)<br />
and in<strong>com</strong>e/<br />
(expense) from<br />
equity investments<br />
accounted for using<br />
equity method - - - - - - - - - - (3,184)<br />
In<strong>com</strong>e taxes - - - - - - - - - - 2,401<br />
Net in<strong>com</strong>e<br />
from continuing<br />
operations - - - - - - - - - - 5,673<br />
Net in<strong>com</strong>e from<br />
discontinued<br />
operations - - - - - - - - - - -<br />
Net in<strong>com</strong>e (Group<br />
and minority<br />
interests) - - - - - - - - - - 5,673<br />
Operating assets 6,162 14,934 316 17,680 77,764 (2) 13,103 (5) 9,654 (8) 1,075 2,529 (5,732) 137,485<br />
Operating liabilities 5,673 4,467 374 5,825 13,500 (3) 5,184 (6) 1,235 (9) 1,166 1,543 (5,734) 33,233<br />
Capital expenditure 62 648 5 1,147 2,866 (4) 1,210 (7) 1,065 (10) 7 80 - 7,090<br />
(1) Segment revenues include both revenues from third parties and revenue flows between the segments. An analogous approach was taken for other in<strong>com</strong>e and<br />
costs for the year.<br />
(2) Of which €484 million regarding units classified as “held for sale”.<br />
(3) Of which €145 million regarding units classified as “held for sale”.<br />
(4) Does not include €76 million regarding units classified as “held for sale”.<br />
(5) Of which €592 million regarding units classified as “held for sale”.<br />
(6) Of which €26 million regarding units classified as “held for sale”.<br />
(7) Does not include €10 million regarding units classified as “held for sale”.<br />
(8) Of which €399 million regarding units classified as “held for sale”.<br />
(9) Of which €14 million regarding units classified as “held for sale”.<br />
(10) Does not include €11 million regarding units classified as “held for sale”.