- Page 1:
Annual Report 2010
- Page 4 and 5:
Contents Enel Annual Report 2010 Re
- Page 7 and 8:
Report on operations
- Page 9 and 10:
Iberia and Latin America Endesa Int
- Page 11 and 12:
operates in the end-user market for
- Page 13 and 14:
Powers Board of Directors The Board
- Page 15 and 16:
The contribution of the operating D
- Page 17 and 18:
The Spanish market saw a turnaround
- Page 19 and 20:
30.8% of its shares are listed on t
- Page 21 and 22:
of 21.4%). More specifically, the p
- Page 23 and 24:
Millions of euro Operating assets O
- Page 25 and 26:
21 10 January Acquisition of Padoma
- Page 27 and 28:
19 April €10 billion revolving li
- Page 29 and 30:
1 July Sale of power transmission n
- Page 31 and 32:
11 10 November Enel and Kepco sign
- Page 33 and 34:
of industrial economies (such as Ge
- Page 35 and 36:
inventories at their highest level
- Page 37 and 38:
Italy The electricity market Domest
- Page 39 and 40:
gradually increasing use, as from 2
- Page 41 and 42:
information on customers who have f
- Page 43 and 44:
Following the hearing of February 1
- Page 45 and 46:
With Resolution ARG/elt no. 211/10,
- Page 47 and 48:
Gas transport and metering rates Wi
- Page 49 and 50:
With Resolution VIS no. 162/10, the
- Page 51 and 52:
Developments in prices in the main
- Page 53 and 54:
lished on January 26, 2011, the Min
- Page 55 and 56:
On July 2, 2010, the CNC had undert
- Page 57 and 58:
ANEEL resolution also provides for
- Page 59 and 60:
daily wholesale market. Specificall
- Page 61 and 62:
the ARENH price will be set with a
- Page 63 and 64:
leading to a final 2010 system cost
- Page 65 and 66:
electricity from hydroelectric plan
- Page 67 and 68:
National renewable energy action pl
- Page 69 and 70:
were held in 2010. Plants with a to
- Page 71 and 72:
USA Carbon regulation On May 12, 20
- Page 73 and 74:
cial receivables in respect of the
- Page 75 and 76:
The performance and balance sheet f
- Page 77 and 78:
Costs Millions of euro 2010 2009 re
- Page 79 and 80:
Analysis of the Group’s financial
- Page 81 and 82:
Sundry provisions, totaling €17,2
- Page 83 and 84:
in long-term financial receivables
- Page 85 and 86:
eceivable in respect of the sale to
- Page 87 and 88:
(1) (2) 2009 results restated Milli
- Page 89 and 90:
1 Sales The Sales Division is respo
- Page 91 and 92:
the free market, which benefited fr
- Page 93 and 94:
Revenues for 2010 totaled €17,540
- Page 95 and 96:
of the International Division, rela
- Page 97 and 98:
Capital expenditure Millions of eur
- Page 99 and 100:
Net efficient generation capacity M
- Page 101 and 102:
an increase of €971 million in th
- Page 103 and 104:
Contribution to gross thermal gener
- Page 105 and 106:
The table below shows performance b
- Page 107 and 108:
Operations Net electricity generati
- Page 109 and 110:
prior-year items recognized in 2009
- Page 111 and 112:
Services and Other Activities The p
- Page 113 and 114:
its generation mix towards the use
- Page 115 and 116:
Country risk By now, some 50% of th
- Page 117 and 118:
Sustainability
- Page 119 and 120:
Sustainability in Enel Providing su
- Page 121 and 122:
Sustainability reporting Since 2002
- Page 123 and 124:
which is needed in order to rationa
- Page 125 and 126:
project, which resulted in hiring a
- Page 127 and 128:
The Nine Points project was one of
- Page 129 and 130:
well as in light of the recent reca
- Page 131 and 132:
sustainability by following the Blu
- Page 133 and 134:
tainability and governance help bus
- Page 135 and 136:
mapping of production sites located
- Page 137 and 138:
Zero-emission thermal power generat
- Page 139 and 140:
developing low-cost distributed pow
- Page 141 and 142:
Electric mobility The “Electric M
- Page 143:
Reconciliation of shareholders’ e
- Page 146 and 147:
Consolidated Income Statement Milli
- Page 148 and 149:
Consolidated Balance Sheet Millions
- Page 150 and 151: Statement of Changes in Consolidate
- Page 152 and 153: Consolidated Statement of Cash Flow
- Page 154 and 155: 2 Accounting policies and measureme
- Page 156 and 157: esposibilities, and their close rel
- Page 158 and 159: and completed before that date are
- Page 160 and 161: Investment property Investment prop
- Page 162 and 163: Financial liabilities Financial lia
- Page 164 and 165: For more information on the estimat
- Page 166 and 167: incorporating the guidelines contai
- Page 168 and 169: classified as equity if (and only i
- Page 170 and 171: Millions of euro LIABILITIES AND SH
- Page 172 and 173: are conducted within the framework
- Page 174 and 175: Expected cash flows from interest r
- Page 176 and 177: The following table reports the cas
- Page 178 and 179: Millions of euro -10% Scenario +10%
- Page 180 and 181: disposal, on September 23, 2009, of
- Page 182 and 183: Segment information for 2010 and 20
- Page 184 and 185: The following table reconciles segm
- Page 186 and 187: The table below gives a breakdown o
- Page 188 and 189: 9.c Personnel - €4,907 million Mi
- Page 190 and 191: Net income/(charges) from commodity
- Page 192 and 193: Financial expense Millions of euro
- Page 194 and 195: Information on the Consolidated Bal
- Page 196 and 197: subsequently sold in December 2010;
- Page 198 and 199: expected future cash flows and appl
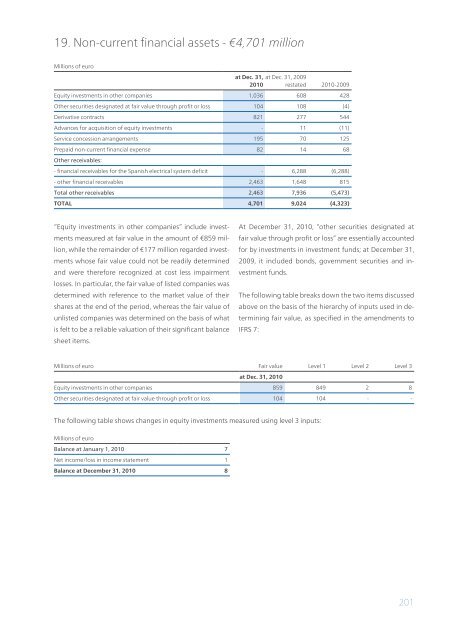
- Page 202 and 203: Equity investments in other compani
- Page 204 and 205: 20. Other non-current assets - €1
- Page 206 and 207: addition to direct reimbursement) b
- Page 208 and 209: Assets held for sale 27. Assets hel
- Page 210 and 211: Non-current liabilities 29. Long-te
- Page 212 and 213: issue of bonds for retail investors
- Page 214 and 215: Current portion of long-term loans
- Page 216 and 217: failure to make payment, breach of
- Page 218 and 219: Millions of euro Pension benefits O
- Page 220 and 221: 31. Provisions for risks and charge
- Page 222 and 223: Commodity derivatives mainly relate
- Page 224 and 225: 36. Current financial liabilities -
- Page 226 and 227: Liabilities held for sale 38. Liabi
- Page 228 and 229: 40. Contractual commitments and gua
- Page 230 and 231: Developments in the inquiries of th
- Page 232 and 233: provisionally enforceable, held the
- Page 234 and 235: creditor rights in respect of CELF
- Page 236 and 237: 43. Stock incentive plans Between 2
- Page 238 and 239: of the dividend (for 2004) of €0.
- Page 240 and 241: that of a specific benchmark index
- Page 242 and 243: Compensation of Directors, members
- Page 245 and 246: Corporate governance
- Page 247 and 248: Major shareholdings and shareholder
- Page 249 and 250: prescribed by the Unified Financial
- Page 251 and 252:
C) The revolving credit facility ag
- Page 253 and 254:
structure, internal auditing system
- Page 255 and 256:
listed companies), distinctly menti
- Page 257 and 258:
University, in Syracuse, New York (
- Page 259 and 260:
The Directors perform their duties
- Page 261 and 262:
letter b) above, have assets exceed
- Page 263 and 264:
sufficient to ensure that their jud
- Page 265 and 266:
compensation of the Chief Executive
- Page 267 and 268:
the power - which may also be exerc
- Page 269 and 270:
Conte is concerned, the Board of St
- Page 271 and 272:
in December 2006, the Board of Dire
- Page 273 and 274:
“independent” monitoring, entru
- Page 275 and 276:
conditions, and those whose conside
- Page 277 and 278:
of the Company’s website (www.ene
- Page 279 and 280:
Ethics consists of: > general princ
- Page 281 and 282:
“Zero Tolerance of Corruption”
- Page 283 and 284:
In principle, unless there are spec
- Page 285:
Internal control Has the Company ap
- Page 288 and 289:
Declaration of the Chief Executive
- Page 291 and 292:
Attachments
- Page 293 and 294:
Subsidiaries consolidated on a line
- Page 295 and 296:
Company name Registered office Coun
- Page 297 and 298:
Company name Registered office Coun
- Page 299 and 300:
Company name Registered office Coun
- Page 301 and 302:
Company name Registered office Coun
- Page 303 and 304:
Company name Registered office Coun
- Page 305 and 306:
Company name Registered office Coun
- Page 307 and 308:
Company name Registered office Coun
- Page 309 and 310:
Company name Registered office Coun
- Page 311 and 312:
Company name Registered office Coun
- Page 313 and 314:
Company name Registered office Coun
- Page 315 and 316:
Company name International Endesa B
- Page 317 and 318:
Enel SpA companies consolidated on
- Page 319 and 320:
Company name Companhia Térmica Rib
- Page 321 and 322:
Company name Registered office Coun
- Page 323 and 324:
Endesa SA companies consolidated on
- Page 325 and 326:
Associated companies accounted for
- Page 327 and 328:
Company name Registered office Coun
- Page 329 and 330:
Company name Registered office Coun
- Page 331 and 332:
Company name P.N. Endesa SA Central
- Page 333 and 334:
Other significant equity investment
- Page 337 and 338:
Reports
- Page 342:
Concept design Inarea - Rome Publis


