Annual Report 2010 - Enel.com
Annual Report 2010 - Enel.com
Annual Report 2010 - Enel.com

You also want an ePaper? Increase the reach of your titles
YUMPU automatically turns print PDFs into web optimized ePapers that Google loves.
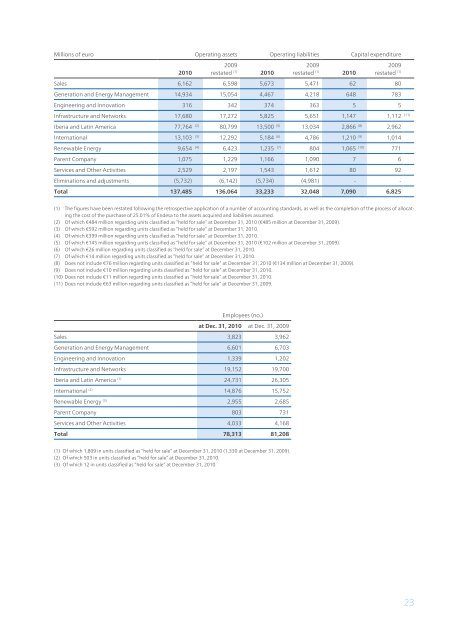
Millions of euro Operating assets Operating liabilities Capital expenditure<br />
<strong>2010</strong><br />
2009<br />
restated (1) <strong>2010</strong><br />
2009<br />
restated (1) <strong>2010</strong><br />
2009<br />
restated (1)<br />
Sales 6,162 6,598 5,673 5,471 62 80<br />
Generation and Energy Management 14,934 15,054 4,467 4,218 648 783<br />
Engineering and Innovation 316 342 374 363 5 5<br />
Infrastructure and Networks 17,680 17,272 5,825 5,651 1,147 1,112 (11)<br />
Iberia and Latin America 77,764 (2) 80,799 13,500 (5) 13,034 2,866 (8) 2,962<br />
International 13,103 (3) 12,292 5,184 (6) 4,786 1,210 (9) 1,014<br />
Renewable Energy 9,654 (4) 6,423 1,235 (7) 804 1,065 (10) 771<br />
Parent Company 1,075 1,229 1,166 1,090 7 6<br />
Services and Other Activities 2,529 2,197 1,543 1,612 80 92<br />
Eliminations and adjustments (5,732) (6,142) (5,734) (4,981) - -<br />
Total 137,485 136,064 33,233 32,048 7,090 6,825<br />
(1) The figures have been restated following the retrospective application of a number of accounting standards, as well as the <strong>com</strong>pletion of the process of allocating<br />
the cost of the purchase of 25.01% of Endesa to the assets acquired and liabilities assumed.<br />
(2) Of which €484 million regarding units classified as “held for sale” at December 31, <strong>2010</strong> (€485 million at December 31, 2009).<br />
(3) Of which €592 million regarding units classified as “held for sale” at December 31, <strong>2010</strong>.<br />
(4) Of which €399 million regarding units classified as “held for sale” at December 31, <strong>2010</strong>.<br />
(5) Of which €145 million regarding units classified as “held for sale” at December 31, <strong>2010</strong> (€102 million at December 31, 2009).<br />
(6) Of which €26 million regarding units classified as “held for sale” at December 31, <strong>2010</strong>.<br />
(7) Of which €14 million regarding units classified as “held for sale” at December 31, <strong>2010</strong>.<br />
(8) Does not include €76 million regarding units classified as “held for sale” at December 31, <strong>2010</strong> (€134 million at December 31, 2009).<br />
(9) Does not include €10 million regarding units classified as “held for sale” at December 31, <strong>2010</strong>.<br />
(10) Does not include €11 million regarding units classified as “held for sale” at December 31, <strong>2010</strong>.<br />
(11) Does not include €63 million regarding units classified as “held for sale” at December 31, 2009.<br />
Employees (no.)<br />
at Dec. 31, <strong>2010</strong> at Dec. 31, 2009<br />
Sales 3,823 3,962<br />
Generation and Energy Management 6,601 6,703<br />
Engineering and Innovation 1,339 1,202<br />
Infrastructure and Networks 19,152 19,700<br />
Iberia and Latin America (1) 24,731 26,305<br />
International (2) 14,876 15,752<br />
Renewable Energy (3) 2,955 2,685<br />
Parent Company 803 731<br />
Services and Other Activities 4,033 4,168<br />
Total 78,313 81,208<br />
(1) Of which 1,809 in units classified as “held for sale” at December 31, <strong>2010</strong> (1,330 at December 31, 2009).<br />
(2) Of which 503 in units classified as “held for sale” at December 31, <strong>2010</strong>.<br />
(3) Of which 12 in units classified as “held for sale” at December 31, <strong>2010</strong>.<br />
23