Annual Report 2010 - Enel.com
Annual Report 2010 - Enel.com
Annual Report 2010 - Enel.com

Create successful ePaper yourself
Turn your PDF publications into a flip-book with our unique Google optimized e-Paper software.
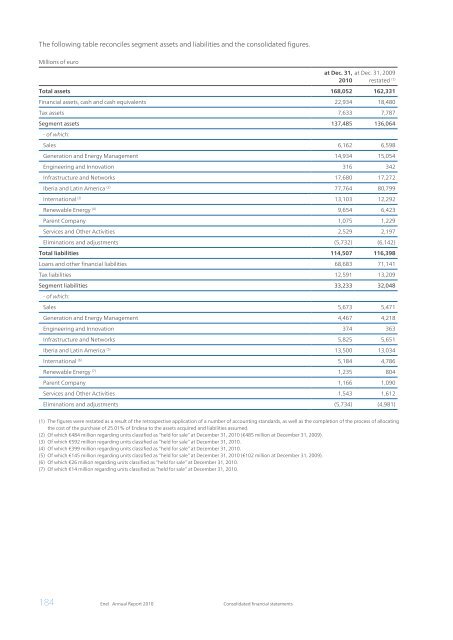
The following table reconciles segment assets and liabilities and the consolidated figures.<br />
Millions of euro<br />
184 <strong>Enel</strong> <strong>Annual</strong> <strong>Report</strong> <strong>2010</strong> Consolidated financial statements<br />
at Dec. 31, at Dec. 31, 2009<br />
<strong>2010</strong> restated (1)<br />
Total assets 168,052 162,331<br />
Financial assets, cash and cash equivalents 22,934 18,480<br />
Tax assets 7,633 7,787<br />
Segment assets 137,485 136,064<br />
- of which:<br />
Sales 6,162 6,598<br />
Generation and Energy Management 14,934 15,054<br />
Engineering and Innovation 316 342<br />
Infrastructure and Networks 17,680 17,272<br />
Iberia and Latin America (2) 77,764 80,799<br />
International (3) 13,103 12,292<br />
Renewable Energy (4) 9,654 6,423<br />
Parent Company 1,075 1,229<br />
Services and Other Activities 2,529 2,197<br />
Eliminations and adjustments (5,732) (6,142)<br />
Total liabilities 114,507 116,398<br />
Loans and other financial liabilities 68,683 71,141<br />
Tax liabilities 12,591 13,209<br />
Segment liabilities 33,233 32,048<br />
- of which:<br />
Sales 5,673 5,471<br />
Generation and Energy Management 4,467 4,218<br />
Engineering and Innovation 374 363<br />
Infrastructure and Networks 5,825 5,651<br />
Iberia and Latin America (5) 13,500 13,034<br />
International (6) 5,184 4,786<br />
Renewable Energy (7) 1,235 804<br />
Parent Company 1,166 1,090<br />
Services and Other Activities 1,543 1,612<br />
Eliminations and adjustments (5,734) (4,981)<br />
(1) The figures were restated as a result of the retrospective application of a number of accounting standards, as well as the <strong>com</strong>pletion of the process of allocating<br />
the cost of the purchase of 25.01% of Endesa to the assets acquired and liabilities assumed.<br />
(2) Of which €484 million regarding units classified as “held for sale” at December 31, <strong>2010</strong> (€485 million at December 31, 2009).<br />
(3) Of which €592 million regarding units classified as “held for sale” at December 31, <strong>2010</strong>.<br />
(4) Of which €399 million regarding units classified as “held for sale” at December 31, <strong>2010</strong>.<br />
(5) Of which €145 million regarding units classified as “held for sale” at December 31, <strong>2010</strong> (€102 million at December 31, 2009).<br />
(6) Of which €26 million regarding units classified as “held for sale” at December 31, <strong>2010</strong>.<br />
(7) Of which €14 million regarding units classified as “held for sale” at December 31, <strong>2010</strong>.