Lead Toxicity in Mute Swans
LEAD TOXICITY IN MUTE SWANS Cygnus olor (Gmelin). By JOHN O'HALLORAN A thesis submitted to the National University of Ireland in candidature for the degree of Doctor of Philosophy September 1987
LEAD TOXICITY IN MUTE SWANS
Cygnus olor (Gmelin).
By
JOHN O'HALLORAN
A thesis submitted to the National University of Ireland
in candidature for the degree of Doctor of Philosophy
September 1987

Create successful ePaper yourself
Turn your PDF publications into a flip-book with our unique Google optimized e-Paper software.
Determ<strong>in</strong>ation of haemoglob<strong>in</strong> <strong>in</strong> birds<br />
Table 2. Haemoglob<strong>in</strong> levels <strong>in</strong> different species of birds (.f ±SE g/100 ml) us<strong>in</strong>g cyanhaemiglob<strong>in</strong> and<br />
ADH-575 methods<br />
..<br />
_/<br />
Specimen No. of Pellet Total Alkal<strong>in</strong>e haemat<strong>in</strong><br />
no. replicates Cyanhaemiglob<strong>in</strong> haemoglob<strong>in</strong> haemoglob<strong>in</strong> ADH-575<br />
Chilean Flam<strong>in</strong>goes<br />
I 10 12. 19 ± 0.42<br />
2 10 13.84 ± 0.32<br />
3 10 12.88 ± 0.16<br />
4 10 13.16±0.13<br />
s 10 12.82 ± 0.25<br />
6 10 12.39 ± 0.27<br />
7 10 12.55 ± 0.19<br />
8 10 13.62 ± 0.28<br />
Black-necked Swan<br />
9 3 11.36 ± 0.64<br />
10 3 14.33 ± 1.00<br />
Emperor Goose<br />
11 3 11.78 ± 0.25<br />
12 3 11.41±0.24<br />
Cape Barren Goose<br />
13 3 14.45 ± 0.63<br />
14 3 14.06 ±0.44<br />
Canada Goose<br />
15 3 14.77 ± 0.46<br />
4.07 ± 0.20 16.26 ± 0.48 15.58 ± 0.63<br />
3.75 ± 0.40 17.60 ± 0.61 16.85 ± 0.17<br />
3.02 ± 0.09 15.90 ± 0.20 15.18±0.22<br />
3.20 ± 0.10 16.35±0.17 16.03 ± 0.25<br />
3.62 ± 0.09 16.44 ± 0.29 16.16 ± 0.42<br />
3.05 ± 0.09 15.45 ± 0.34 14.97 ± 0.15<br />
3.52 ± 0.09 16.07 ± 0.25 15.23 ± 0.22<br />
3.44 ± 0.08 17.06 ±0.27 16.25 ± 0.19<br />
2.72 ± 0.20 14.20 ± 0.91 14.33 ±0.11<br />
3.44 ±0.26 17.78 ± 1.30 17.18 ±0.26<br />
2.94 ± 0.09 14.92 ± 0.33 15.37 ±0.15<br />
2.94 ± O.D7 14.34 ± 0.26 14.77 ± 0.46<br />
3.00 ± 0.60 17.70 ± 0.73 17.29 ± 0.40<br />
3.88 ± 0.36 17.10 ± 0.65 17.95 ± 0.11<br />
3.80 ± 0.12 18.57 ± 0.50 18.67 ± 0.56<br />
One of the most significant aspects of this study is<br />
the difference <strong>in</strong> haemoglob<strong>in</strong> levels which results<br />
from the ADH-575 method and the reference<br />
method. In all cases the difference between the two<br />
methods was constant and proportional to the level<br />
of haemoglob<strong>in</strong> <strong>in</strong> the specimen (Table 2). The<br />
difference <strong>in</strong> haemoglob<strong>in</strong> levels is attributed to the<br />
proportion which is lost dur<strong>in</strong>g <strong>in</strong>complete haemolysis<br />
us<strong>in</strong>g Drabk<strong>in</strong>'s solution <strong>in</strong> the cyanhaemiglob<strong>in</strong><br />
procedure. Follow<strong>in</strong>g centrifugation the<br />
supernatant appeared as a clear solution of cyanhaemiglob<strong>in</strong>;<br />
the cells and debris (pellet), on the<br />
other hand, were bright red <strong>in</strong> colour. A similar<br />
situation was found by Hunter et al. (1940) us<strong>in</strong>g acid<br />
haemat<strong>in</strong> with chicken blood. In his study he found<br />
partial retention of haemoglob<strong>in</strong> <strong>in</strong> a pellet follow<strong>in</strong>g<br />
addition of acid and centrifugation.<br />
In this study, on add<strong>in</strong>g ADH reagent to the wet<br />
pellet the solution quickly turned green as haemoglob<strong>in</strong><br />
was extracted. The sum of the pellet haemoglob<strong>in</strong><br />
and supernatant cyanhaemiglob<strong>in</strong> was<br />
.,.,<br />
19.00<br />
18.00<br />
17.00<br />
:;:; 16.00<br />
·= ls:oo<br />
~<br />
..c 14.00<br />
.: 13.00<br />
:;<br />
~<br />
12.00<br />
<<br />
11.00<br />
c<br />
10.00 c c<br />
9.00<br />
7.00 !LOO 9.00 10.00 11.0ll 12.00 13.00 14.00 15.00<br />
Cyanhaemiglob<strong>in</strong><br />
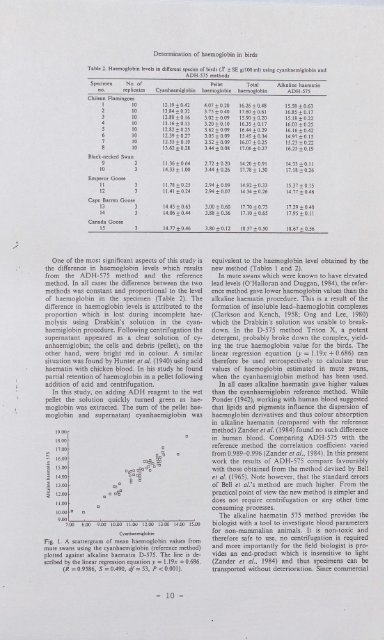
Fig. 1. A scattergram of mean haemoglob<strong>in</strong> values from<br />
mute swans us<strong>in</strong>g the cyanhaemiglob<strong>in</strong> (reference method)<br />
plotted aga<strong>in</strong>st alkal<strong>in</strong>e haemat<strong>in</strong> D-575. The l<strong>in</strong>e is described<br />
by the l<strong>in</strong>ear regression equation y = l.19x + 0.686.<br />
(R = 0.9586, S = 0.490, df = 53, P < 0.001).<br />
c<br />
c<br />
equivalent to the haemoglob<strong>in</strong> level obta<strong>in</strong>ed by the<br />
new method (Tables 1 and 2).<br />
In mute swans which were known to have elevated<br />
lead levels (O'Halloran and Duggan, 1984), the reference<br />
method gave lower haemoglob<strong>in</strong> values than the<br />
alkal<strong>in</strong>e haemat<strong>in</strong> procedure. This is a result of the<br />
formation of <strong>in</strong>soluble lead-haemoglob<strong>in</strong> complexes<br />
(Clarkson and Kench, 1958; Ong and Lee, 1980)<br />
which the Drabk<strong>in</strong>'s solution was unable to breakdown.<br />
In the D-575 method Triton X, a potent<br />
detergent, probably broke down the complex, yield<strong>in</strong>g<br />
the true haemoglob<strong>in</strong> value for the birds. The<br />
l<strong>in</strong>ear regression equation (y = l.19x + 0.686) can<br />
therefore be used retrospectively to calculate true<br />
values of haemoglob<strong>in</strong> estimated <strong>in</strong> mute swans,<br />
when the cyanhaemiglob<strong>in</strong> method has been used.<br />
In all cases alkal<strong>in</strong>e haemat<strong>in</strong> gave higher values<br />
than the cyanhaemiglob<strong>in</strong> reference method. While<br />
Ponder (1942), work<strong>in</strong>g with human blood suggested<br />
that lipids and pigments <strong>in</strong>fluence the dispersion of<br />
haemoglob<strong>in</strong> derivatives and thus colour absorption<br />
<strong>in</strong> alkal<strong>in</strong>e haemat<strong>in</strong> (compared with the reference<br />
method) Zander et al. (1984) found no such difference<br />
<strong>in</strong> human blood. Compar<strong>in</strong>g ADH-575 with the<br />
reference method the correlation coefficient varied<br />
from 0.989--0.996 (Zander et al., 1984). In this present<br />
work the results of ADH-575 compare favourably<br />
with those obta<strong>in</strong>ed from the method devised by Bell<br />
et al. (1965). Note however, that the standard errors<br />
of Bell et al.'s method are much higher. From the<br />
practical po<strong>in</strong>t of view the new method is simpler and<br />
does not require centrifugation or any other time<br />
consum<strong>in</strong>g processes.<br />
The alkal<strong>in</strong>e haemat<strong>in</strong> 575 method provides the<br />
biologist with a tool to <strong>in</strong>vestigate blood parameters<br />
for non-mammalian animals. It is non-toxic and<br />
therefore safe to use, no centrifugation is required<br />
and more importantly for the field biologist is provides<br />
an end-product which is <strong>in</strong>sensitive to light<br />
(Zander et al., 1984) and thus specimens can be<br />
transported without deterioration. S<strong>in</strong>ce commercial<br />
- 10 -