Lead Toxicity in Mute Swans
LEAD TOXICITY IN MUTE SWANS Cygnus olor (Gmelin). By JOHN O'HALLORAN A thesis submitted to the National University of Ireland in candidature for the degree of Doctor of Philosophy September 1987
LEAD TOXICITY IN MUTE SWANS
Cygnus olor (Gmelin).
By
JOHN O'HALLORAN
A thesis submitted to the National University of Ireland
in candidature for the degree of Doctor of Philosophy
September 1987
Create successful ePaper yourself
Turn your PDF publications into a flip-book with our unique Google optimized e-Paper software.
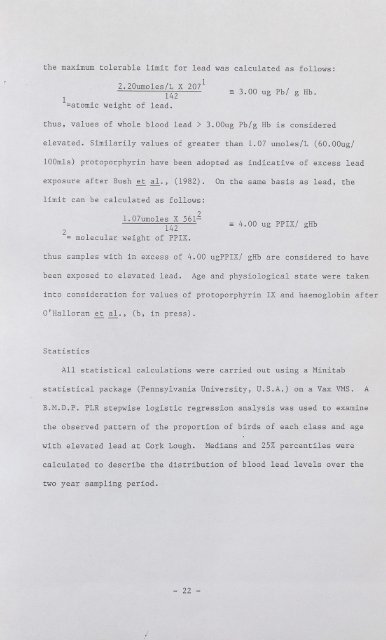
the maximum tolerable limit for lead was calculated as follows:<br />
2.20umoles/L X 207 1<br />
142<br />
- 3.00 ug Pb/ g Rb.<br />
1 =atomic weight of lead.<br />
thus, values of whole blood lead > 3.00ug Pb/g Rb is considered<br />
elevated. Similarily values of greater than 1.07 umoles/L (60.00ug/<br />
lOOmls) protoporphyr<strong>in</strong> have been adopted as <strong>in</strong>dicative of excess lead<br />
exposure after Bush~ al., (1982).<br />
On the same . basis as lead, the<br />
limit can be calculated as follows:<br />
2<br />
l.07umoles X 5612<br />
142<br />
molecular weight of PPIX.<br />
- 4.00 ug PPIX/ gRb<br />
thus samples with <strong>in</strong> excess of 4.00 ugPPIX/ gRb are considered to have<br />
been exposed to elevated lead.<br />
Age and physiological state were taken<br />
<strong>in</strong>to consideration for values of protoporphyr<strong>in</strong> IX and haemoglob<strong>in</strong> after<br />
O'Ralloran ~al.,<br />
(b, <strong>in</strong> press).<br />
Statistics<br />
All statistical calculations were carried out us<strong>in</strong>g a M<strong>in</strong>itab<br />
statistical package (Pennsylvania University, U.S.A.) on a Vax VMS.<br />
A<br />
B.M.D.P. PLR stepwise logistic regression analysis was used to exam<strong>in</strong>e<br />
the observed pattern of the proportion of birds of each class and age<br />
with elevated lead at Cork Lough.<br />
Medians and 25% percentiles were<br />
calculated to describe the distribution of blood lead levels over the<br />
two year sampl<strong>in</strong>g period.<br />
- 22 -<br />
I<br />
r


